SCAD
2025
Project Overview:
Designed for autonomous vehicles, this adaptive
in-car interface builds trust, delivers real-time guidance, and offers transparent feedback especially for first-time users while adding personalized entertainment for a comfortable, enjoyable ride.
Team:
Stef Baracaldo, Hyunsoo Eun,
Masey McQueeney, Veronica
Charging
100%
72°F
Temperature
66%
Humidity
32
Air Flow
Good morning Jason
Where to?


292
Raw Data Points From Survey’s and Interview’s
Role
Lead UI Designer
Duration
10 Weeks
Year
2025
Responsibilities
Wireframing, Design Systems, Prototyping, etc.
our goal...
To design an intuitive, adaptive, and emotionally intelligent dashboard UI for fully autonomous vehicles shifting from driver-focused control to a passenger-first experience centered on engagement, safety, and personalization
My Role
Throughout the project, I was deeply involved in every stage, with a focus on translating insights into clear, actionable design solutions. As the UI and Visual Design Lead, I led the creation of layouts, design systems, and final visuals ensuring that each screen was both user-friendly and visually cohesive.


Child Mind Institute
Science
https://childmind.org/article/understanding-dysgraphia
Separately, apart from these motor issues, there is a cognitive side to dysgraphia. The cognitive challenges include struggling with spelling, grammar, punctuation, sentence structure, and overall written expression. A child with dysgraphia might have a hard time translating their ideas onto paper.
Insight
National Library of Medicine
Science
https://pmc.ncbi.nlm.nih.gov/articles/PMC7082241
Writing is a complex task that is vital to learning and is usually acquired in the early years of life. ‘Dysgraphia’ and ‘specific learning disorder in written expression’ are terms used to describe those individuals who, despite exposure to adequate instruction, demonstrate writing ability discordant with their cognitive level and age. Dysgraphia can present with different symptoms at different ages.
Insight
New York Times
Education
https://nylag.org/the-new-york-times-struggling-teenagers-left-out-in-new-push-to-overhaul-reading
Students with dyslexia have trouble looking at the written word and blending the sounds into language. The city has rolled out universal screening to help identify these children in elementary grades, officials said. But few older students have been assessed.
Insight
Physical Therapy
https://www.frontiersin.org/journals/psychology/articles/10.3389/fpsyg.2018.02006
Developmental dysgraphia is a disorder of writing/spelling skills, closely related to developmental dyslexia. For developmental dyslexia, profiles with a focus on phonological, attentional, visual or auditory deficits have recently been established. Unlike for developmental dyslexia, however, there are only few studies about dysgraphia, in particular about the variability of its causes. Research has demonstrated high similarity between developmental dyslexia and dysgraphia.
Insight
Child Mind Institute
Science
https://childmind.org/article/understanding-dysgraphia
Separately, apart from these motor issues, there is a cognitive side to dysgraphia. The cognitive challenges include struggling with spelling, grammar, punctuation, sentence structure, and overall written expression. A child with dysgraphia might have a hard time translating their ideas onto paper.
Insight
New York Times
Education
https://childmind.org/article/understanding-dysgraphia
Separately, apart from these motor issues, there is a cognitive side to dysgraphia. The cognitive challenges include struggling with spelling, grammar, punctuation, sentence structure, and overall written expression. A child with dysgraphia might have a hard time translating their ideas onto paper.
Insight


NOAA Uncrewed Systems Strategy
Science
https://childmind.org/article/understanding-dysgraphia
Separately, apart from these motor issues, there is a cognitive side to dysgraphia. The cognitive challenges include struggling with spelling, grammar, punctuation, sentence structure, and overall written expression. A child with dysgraphia might have a hard time translating their ideas onto paper.
Insight
Sustainable Supply Chains
Science
https://pmc.ncbi.nlm.nih.gov/articles/PMC7082241
Writing is a complex task that is vital to learning and is usually acquired in the early years of life. ‘Dysgraphia’ and ‘specific learning disorder in written expression’ are terms used to describe those individuals who, despite exposure to adequate instruction, demonstrate writing ability discordant with their cognitive level and age. Dysgraphia can present with different symptoms at different ages.
Insight
New York Times
Education
https://nylag.org/the-new-york-times-struggling-teenagers-left-out-in-new-push-to-overhaul-reading
Students with dyslexia have trouble looking at the written word and blending the sounds into language. The city has rolled out universal screening to help identify these children in elementary grades, officials said. But few older students have been assessed.
Insight
Physical Therapy
https://www.frontiersin.org/journals/psychology/articles/10.3389/fpsyg.2018.02006
Developmental dysgraphia is a disorder of writing/spelling skills, closely related to developmental dyslexia. For developmental dyslexia, profiles with a focus on phonological, attentional, visual or auditory deficits have recently been established. Unlike for developmental dyslexia, however, there are only few studies about dysgraphia, in particular about the variability of its causes. Research has demonstrated high similarity between developmental dyslexia and dysgraphia.
Insight
Renewable Energy
Science
https://childmind.org/article/understanding-dysgraphia
Separately, apart from these motor issues, there is a cognitive side to dysgraphia. The cognitive challenges include struggling with spelling, grammar, punctuation, sentence structure, and overall written expression. A child with dysgraphia might have a hard time translating their ideas onto paper.
Insight
New York Times
Education
https://childmind.org/article/understanding-dysgraphia
Separately, apart from these motor issues, there is a cognitive side to dysgraphia. The cognitive challenges include struggling with spelling, grammar, punctuation, sentence structure, and overall written expression. A child with dysgraphia might have a hard time translating their ideas onto paper.
Insight
25 Articles
Analyzed
We reviewed a range of academic and industry sources, including
peer-reviewed studies and expert reports, chosen for their credibility and relevance to autonomous vehicles. Each provided valuable insights into user experience, interface design, system transparency, and emerging in-car technologies.
The Problem
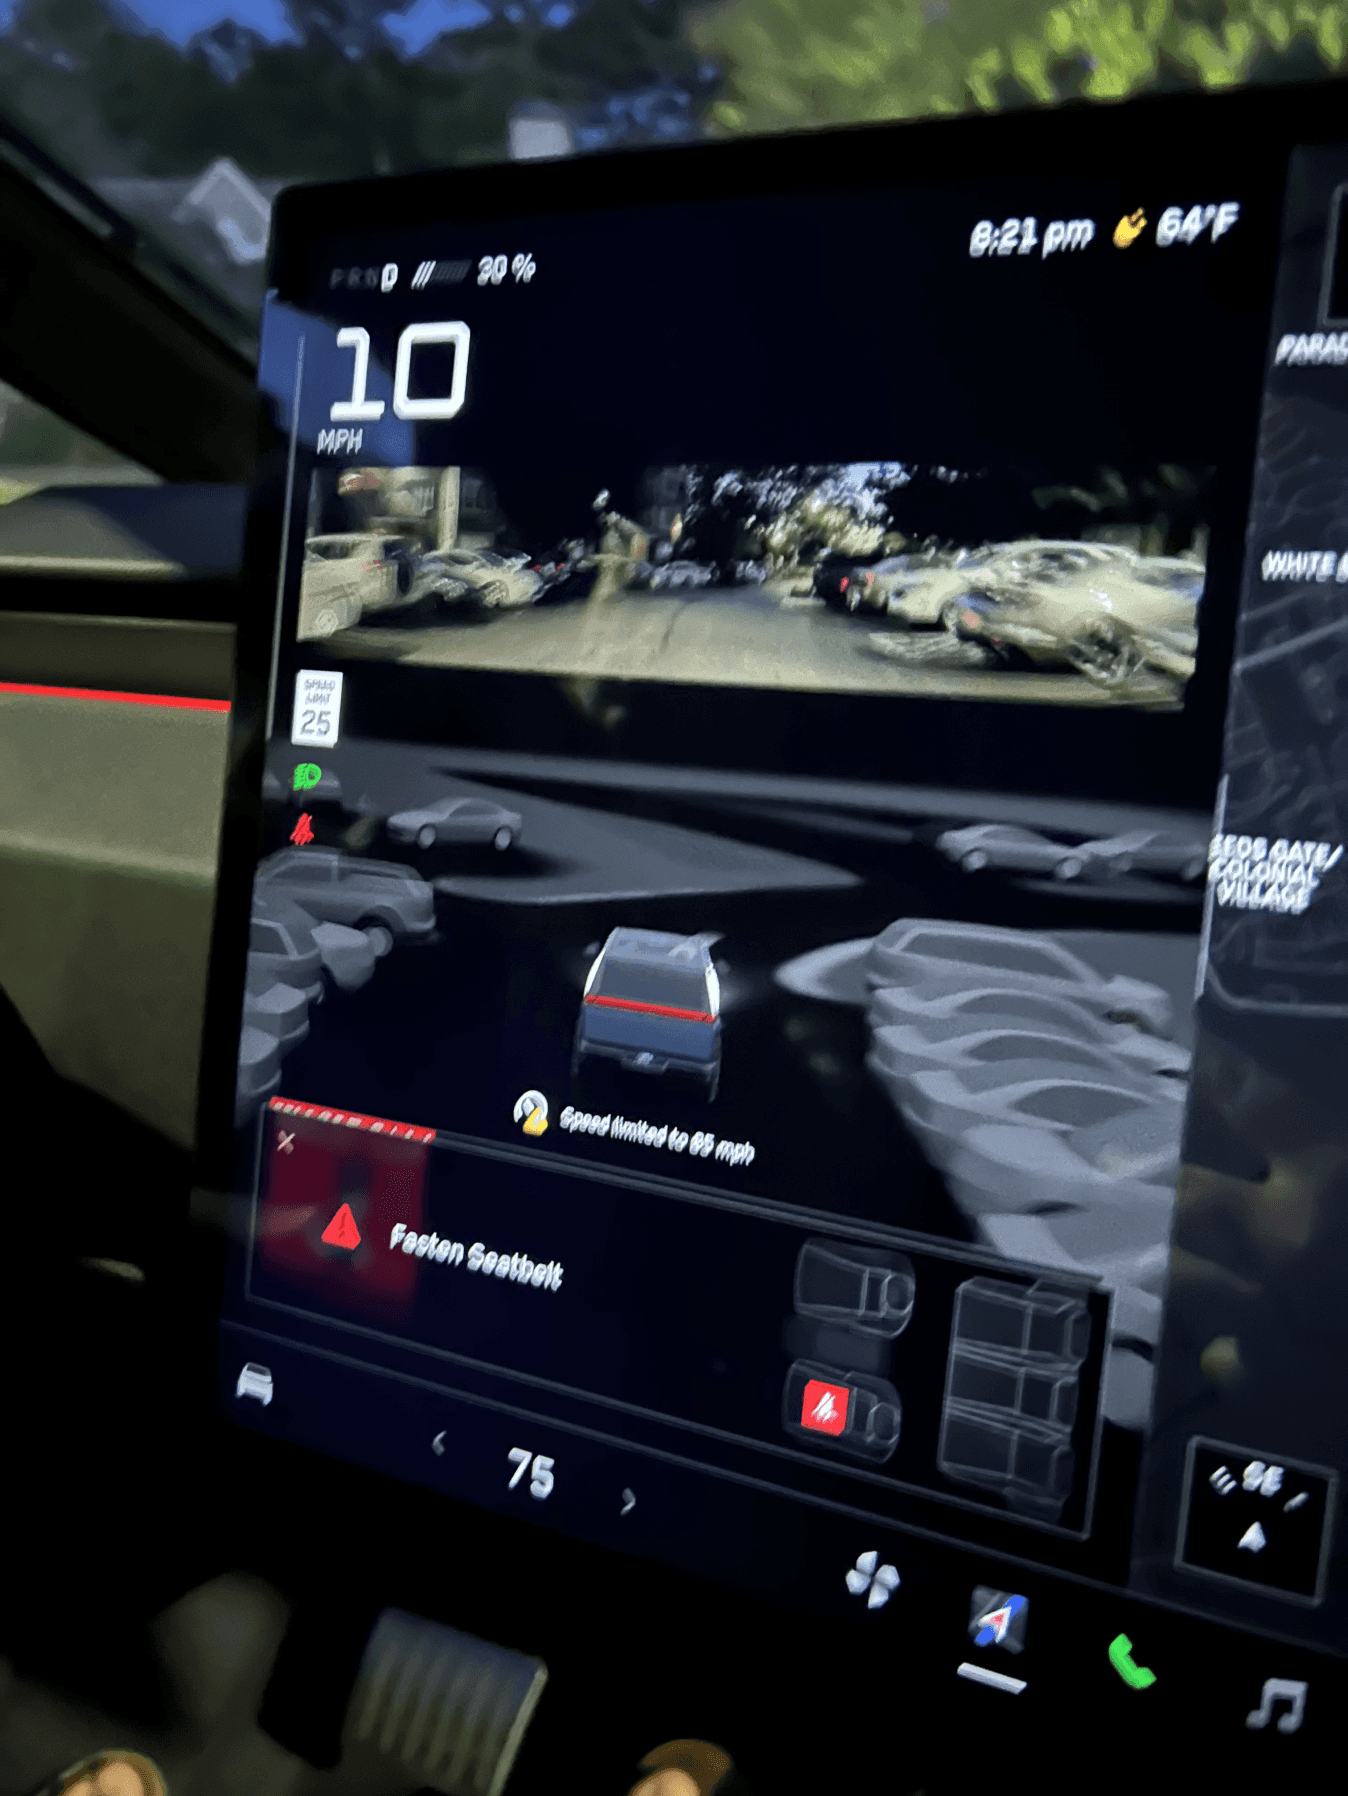
Many autonomous vehicles today lack intuitive, user-friendly interfaces. First-time users often feel confused or uneasy, unsure how to interact with the system or trust what the vehicle is doing. This makes the experience uncomfortable and limits wider adoption.
Research Plan
How research and data guided our product decisions
Research
25
Articles
06
Interviews
01
Observation
28
Survey Responses
Insights
After analyzing the sources, we distilled key insights, useful data points, and impactful quotes that shaped our understanding of current UX challenges and helped guide our design approach.
65% of global respondents don't feel safe in a AV
Cleveland Clinic
Around 90% of traffic accidents are caused by human error
NDE

Main Insight
When users feel like silent observers rather than informed participants, confusion and discomfort replace confidence. Today’s interfaces often overlook this emotional gap, making transparency and intuitive communication essential to a positive passenger experience.
On a scale of 1–5, how confident are you in the accuracy of your current fuel/power data?
Type your response...
What tools, if any, do you use to monitor fuel or power consumption?
Type your response...
How aware are you of your port’s total energy usage on a weekly or monthly basis?
Type your response...
What percentage of your equipment and vehicles are gasoline- or diesel-powered?
Type your response...
Are any operations currently electrified? If yes, which ones?
Type your response...
Have you explored electric alternatives for any part of your operations?
Type your response...
Do you currently track fuel consumption across daily operations?
Type your response...
What are the biggest pain points in managing fuel-powered operations?
Type your response...
Survey
To complement our secondary research, we surveyed over 28 participants including first-time AV users, tech-savvy commuters, and mobility experts to gather firsthand insights on user expectations, trust barriers, and the everyday challenges of interacting with autonomous systems.
Interviews
We interviewed 30 participants including port professionals, operators, and energy coordinators to gain firsthand insights into daily operations, energy challenges, and views on sustainability transitions.
06
50%
50%
Interviewees
first time AV drivers / little experience
AV driver natives / lots of experience
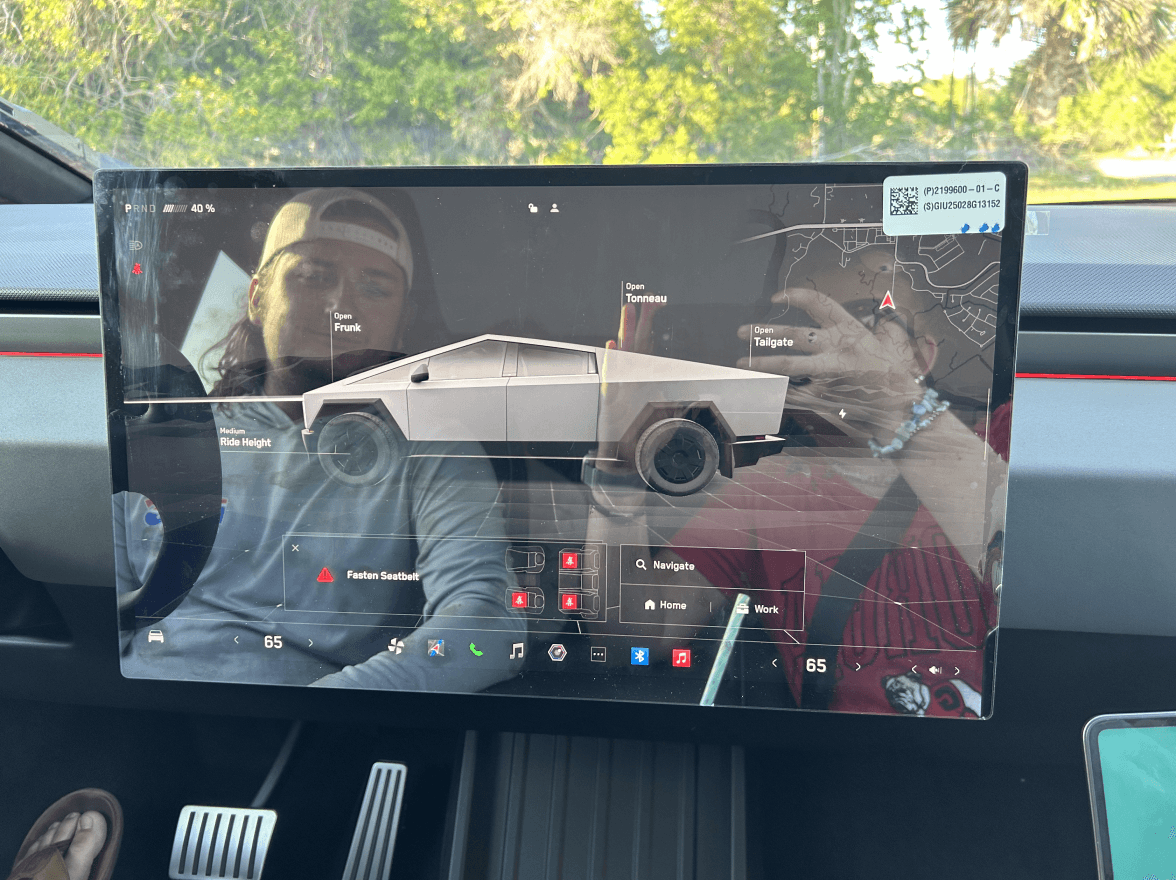
Observation
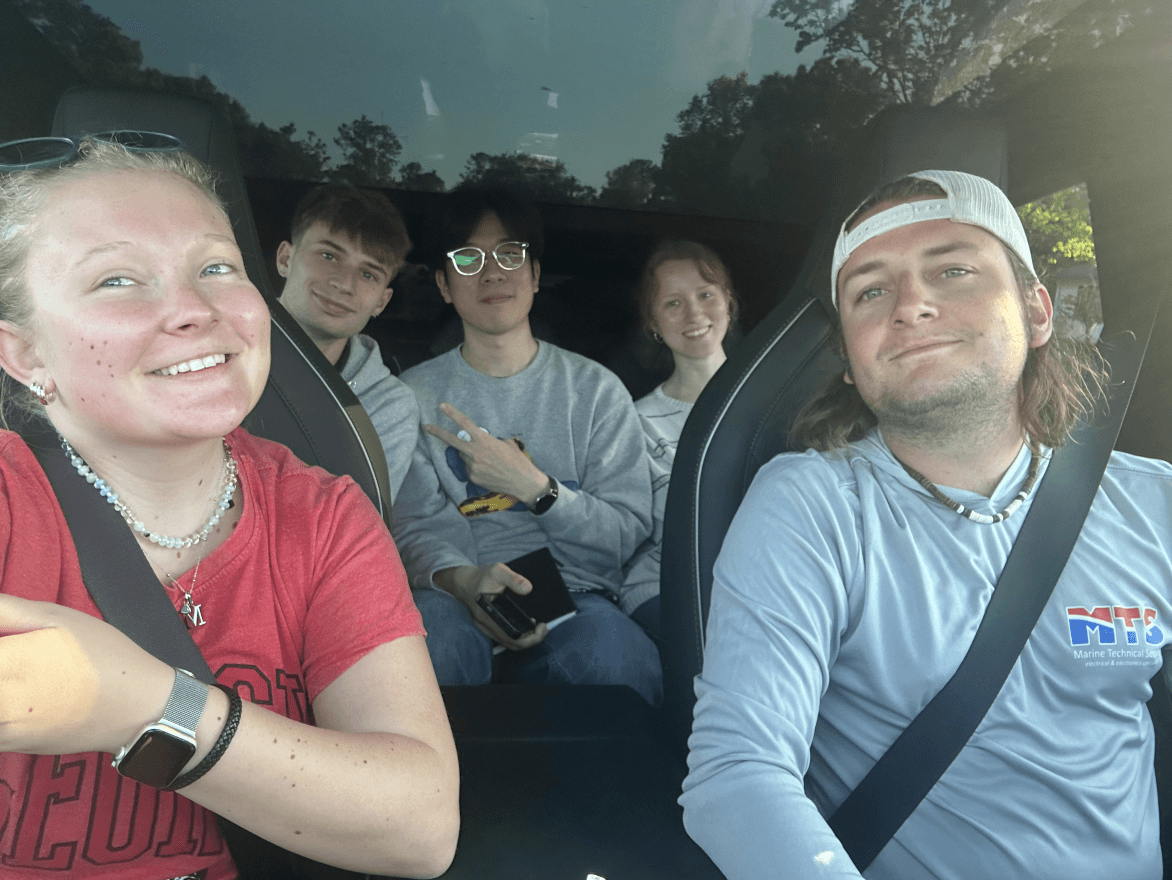
We toured and test drove a Tesla Cybertruck, gaining firsthand insight into its design, features, and potential role in future autonomous transportation.
Problem Statement
Many autonomous vehicles today lack intuitive, user-friendly interfaces. First-time users often feel confused or uneasy, unsure how to interact with the system or trust what the vehicle is doing. This makes the experience uncomfortable and limits wider adoption.
For new users, autonomous vehicle interfaces often feel foreign, confusing, unintuitive, and sometimes intimidating. This unfamiliarity leads to discomfort and hinders wider adoption.
Target Audience

AV Drivers

AV Vehicle Manufacturers
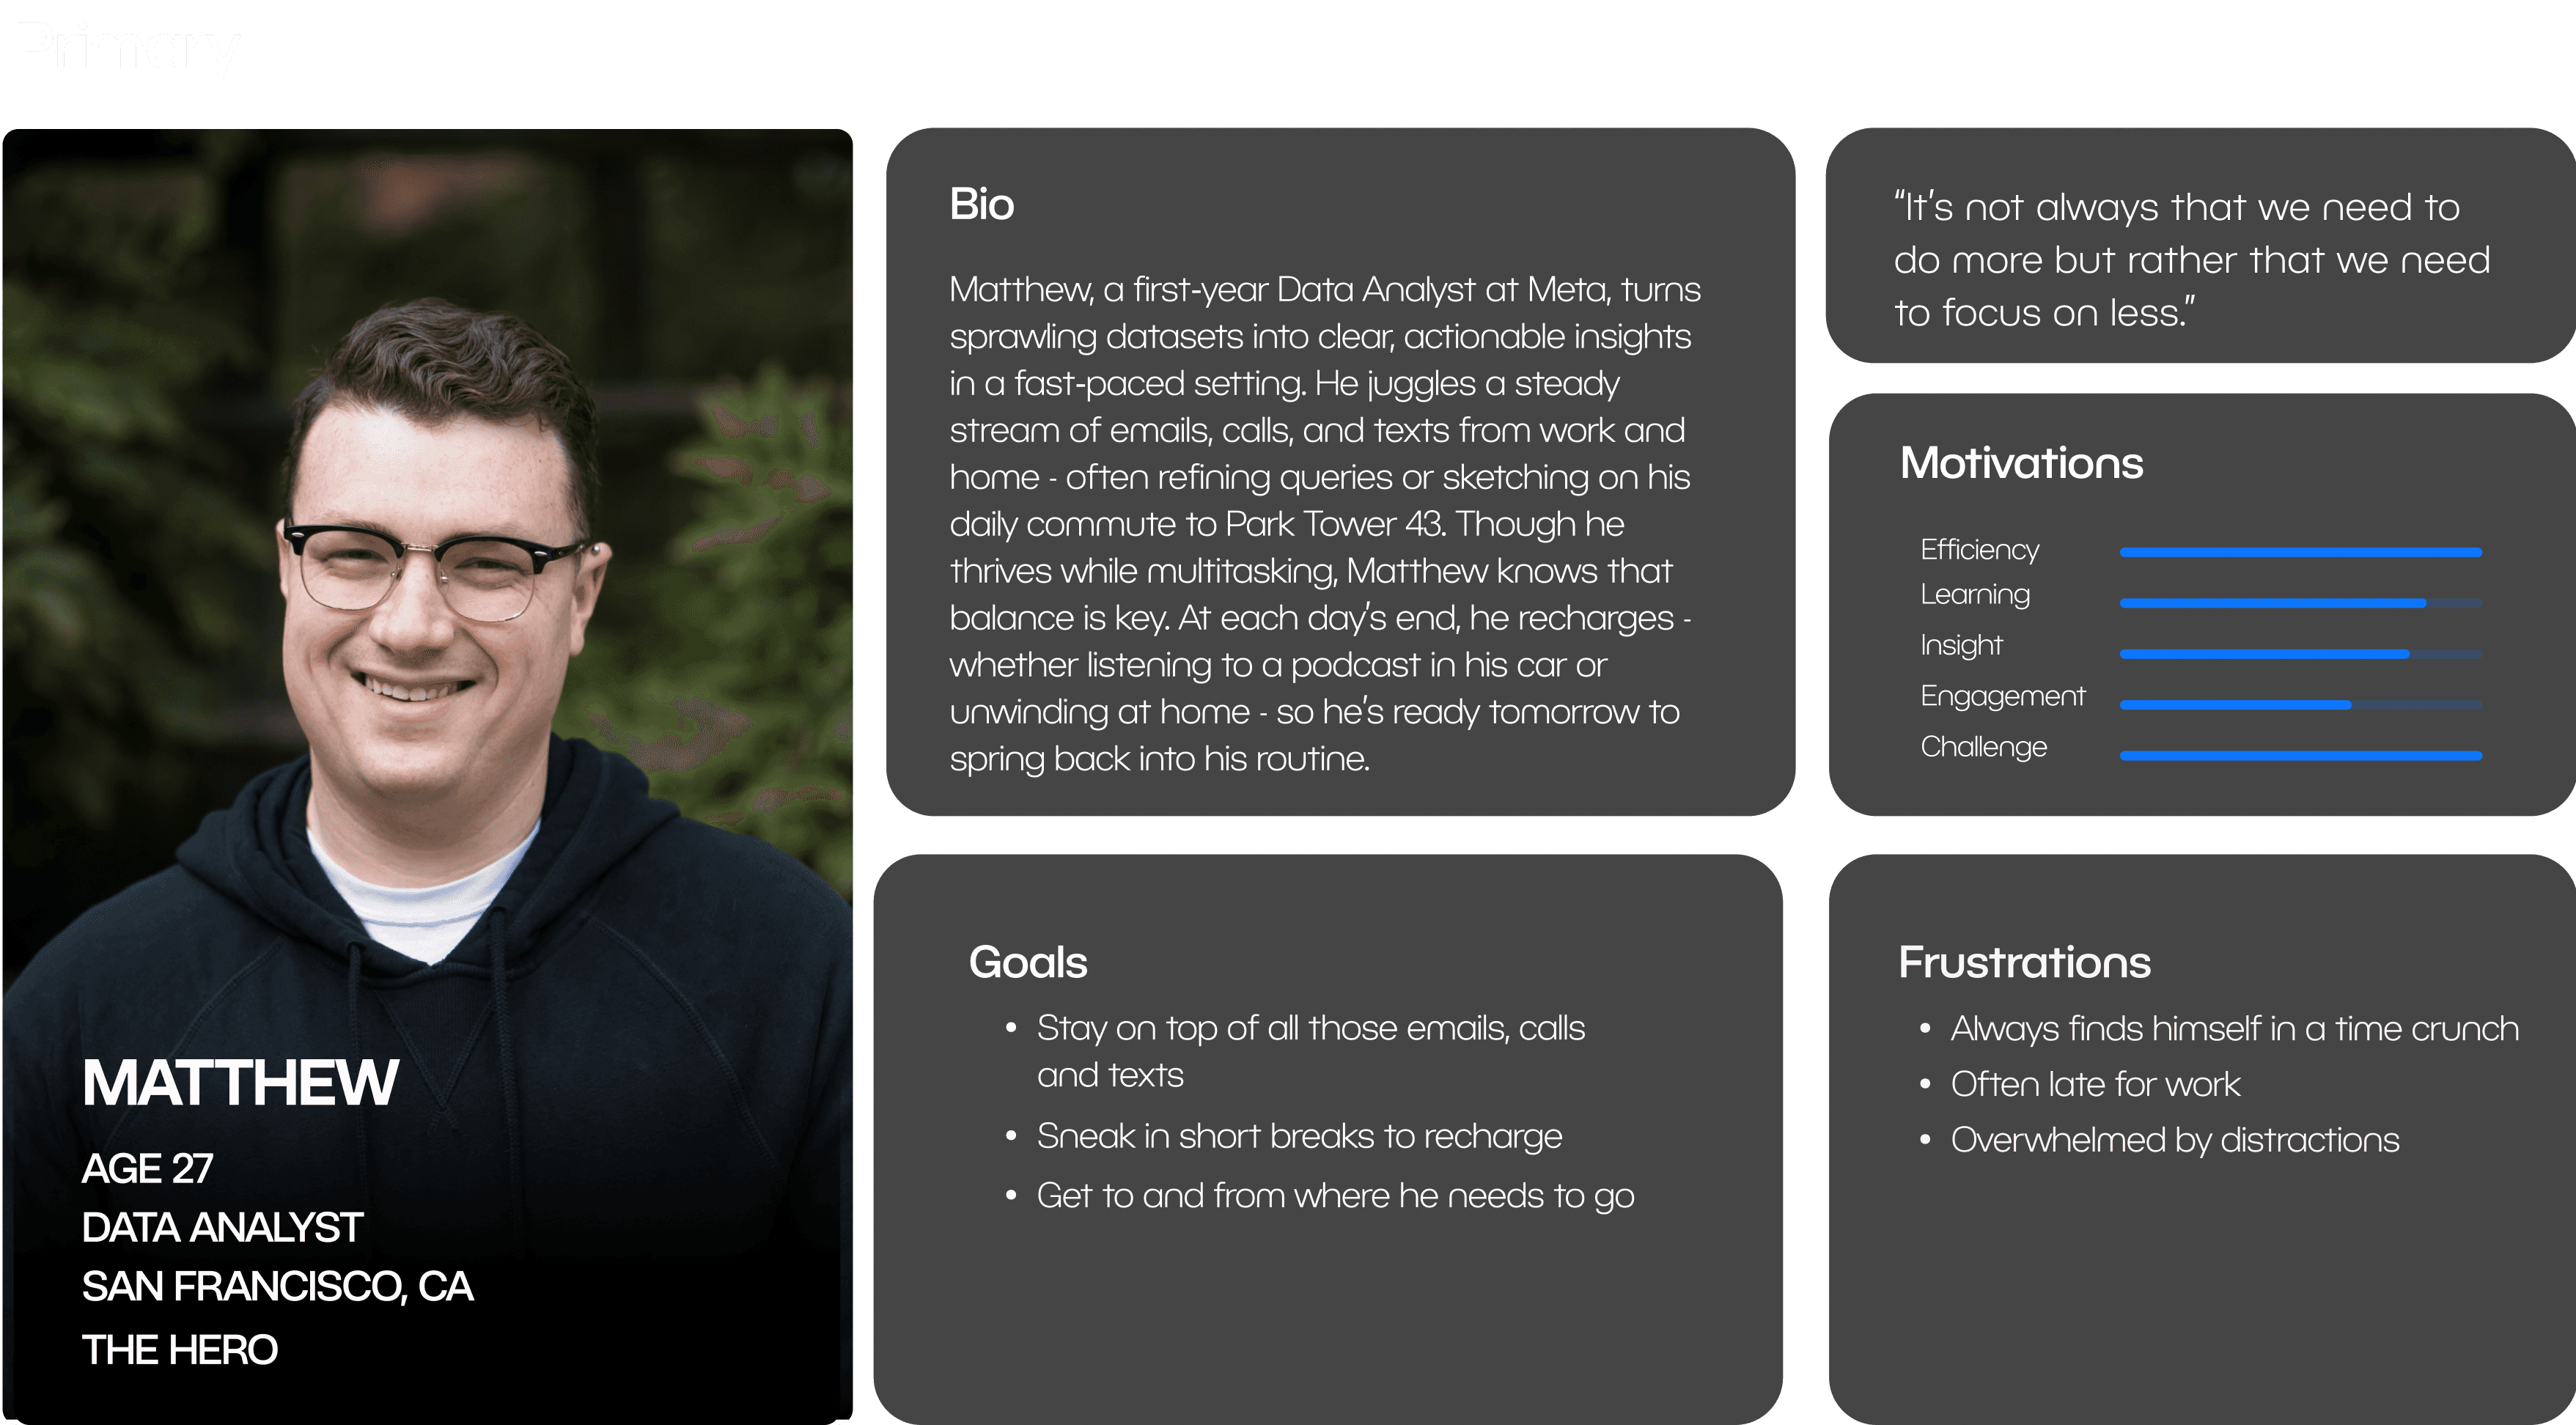
Personas
We used insights from our primary research to develop detailed personas and an empathy map that accurately reflect our target audience
Journey Map
Walking through a Sustainability Director’s day-to-day process revealed key emotional moments, actions, and breakdowns especially where lack of data and visibility made progress toward sustainability feel slow, frustrating, and uncertain.
Features
Pre Drive
Setup
Self Drive
Manual Drive
End of Trip
Actions
Looks for familiar controls like a key or button
Pauses to inspect the dashboard/interface
May search for instructions or a help guide
Attempts to input a destination or activate the system
Fumbles with touchscreen or voice commands
Tries to adjust seat, climate, or infotainment settings
Watches the road nervously
Glances repeatedly at dashboard for reassurance
May hover hand near controls “just in case”
Takes control hesitantly
Tries to reorient to traditional driving feel
Struggles to understand when and how to regain control
Waits for car to park itself (if applicable)
Looks for exit instructions
Tries to review trip summary or provide feedback
"How do I even start this?"
"Where's the steering wheel… is this thing going to drive itself?"
"What if I do something wrong?"
"Is it listening to me?"
"What does this button do?"
"Why is this so complicated for something that's supposed to be easy?"
"Is it really seeing that stop sign?"
"Should I take over?"
"Why is it slowing down here?"
"Am I supposed to take over now?"
"Why didn’t it warn me sooner?"
"This handoff feels awkward."
"That wasn’t as bad as I expected..."
"I still don’t know what half of those buttons did."
"Would I do that again?"
Curious but anxious
Intimidated by unfamiliar layout
Distrustful or uncertain about safety
Frustrated or overwhelmed
Impatient
Lacking confidence in the interface
On edge or alert
Distrustful of system decisions
Gradual relief (if the ride is smooth)
Nervous, pressured
Confused by unclear transitions
Temporarily more in control, but uncertain
Mixed relief and lingering doubt
Mild accomplishment or growing curiosity
Possibly still disconnected from the system experience
Thoughts
Feelings
Final Deliverables

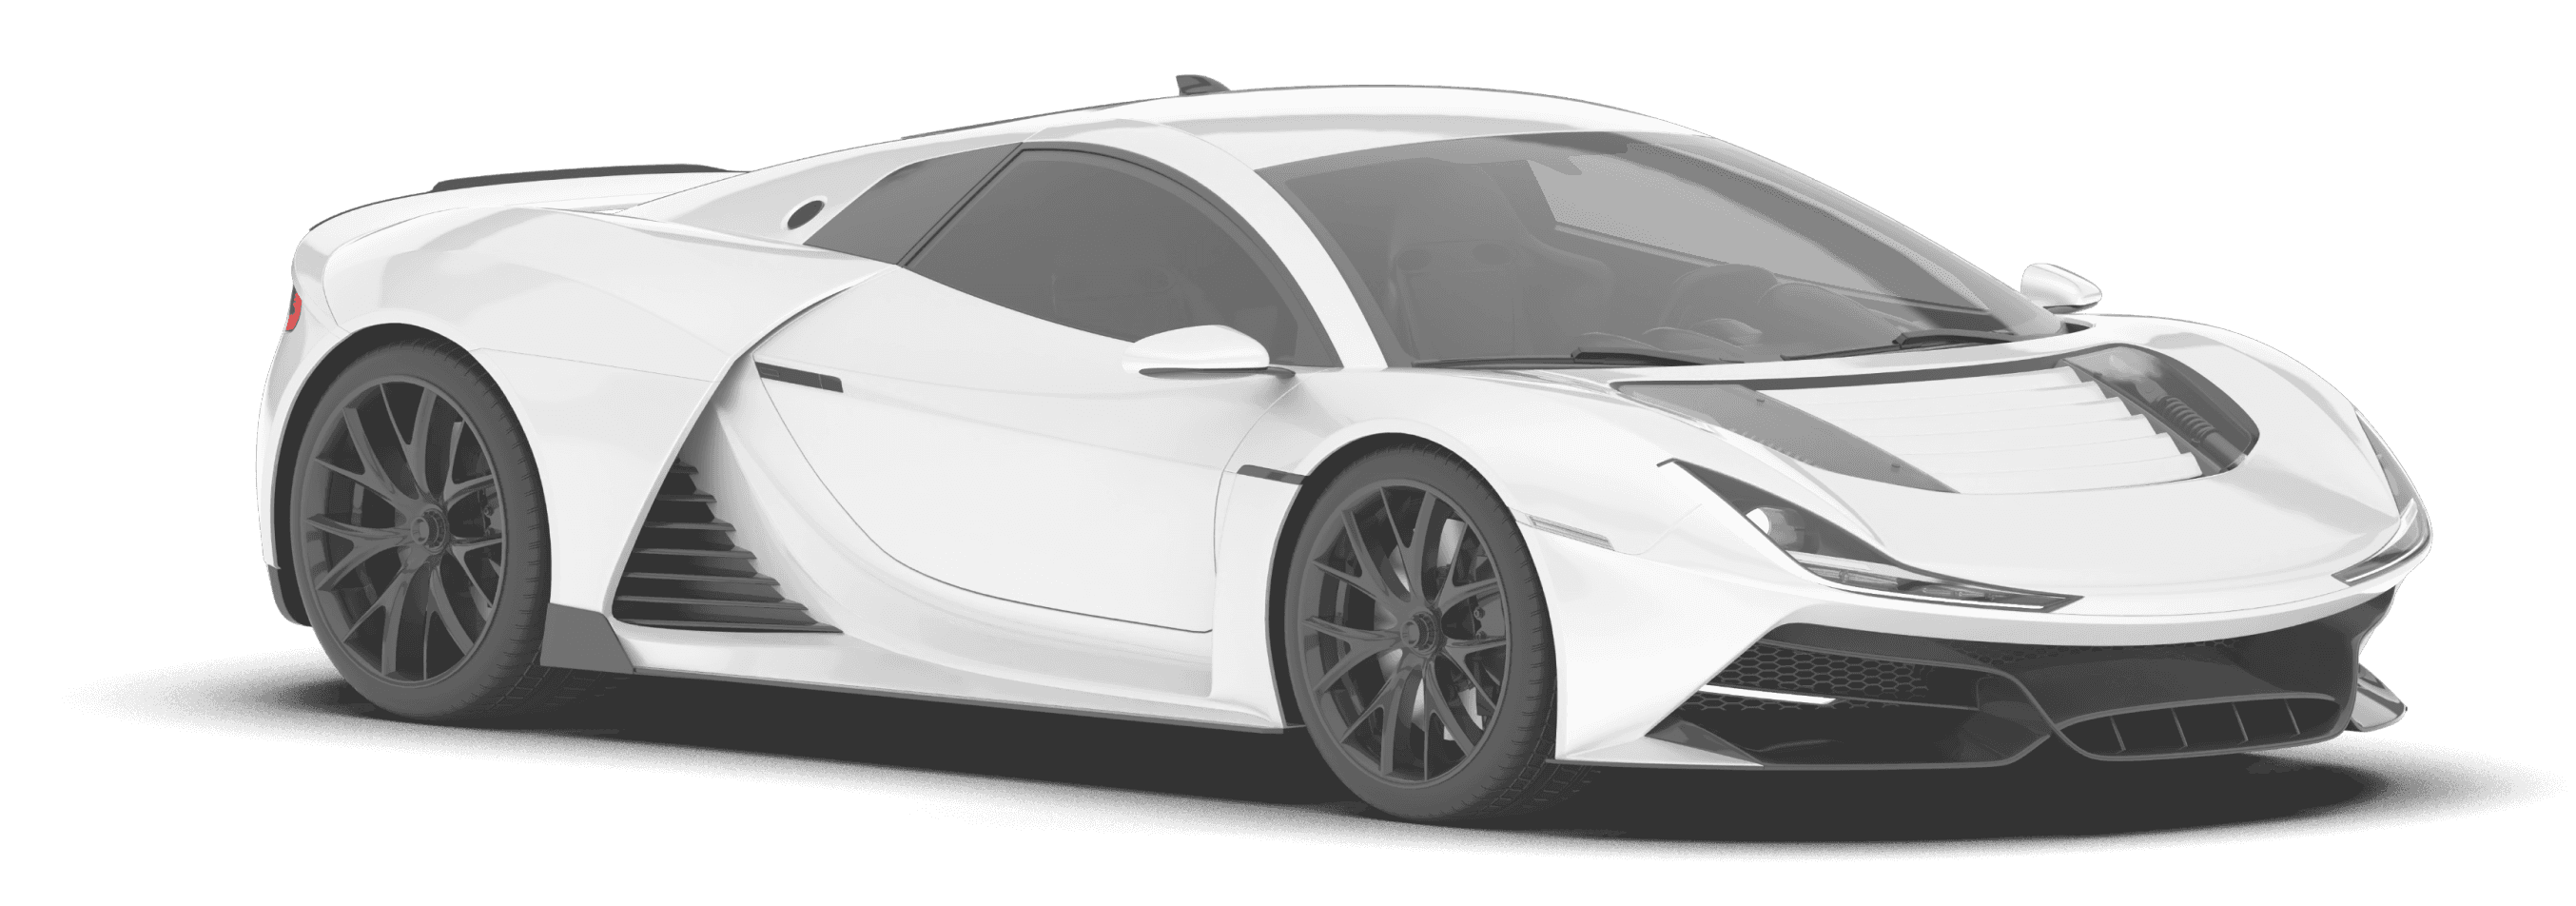
car dashboard
How might we...
How might we create clear, intuitive interactions that help new users understand what the vehicle is doing and why?
Proposed Concept
An adaptive in-car interface designed to build trust and reduce confusion for all passengers, while specifically supporting first-time autonomous vehicle users by offering real-time guidance, emotional reassurance, and clear system transparency paired with personalized entertainment to make the ride both intuitive and enjoyable.
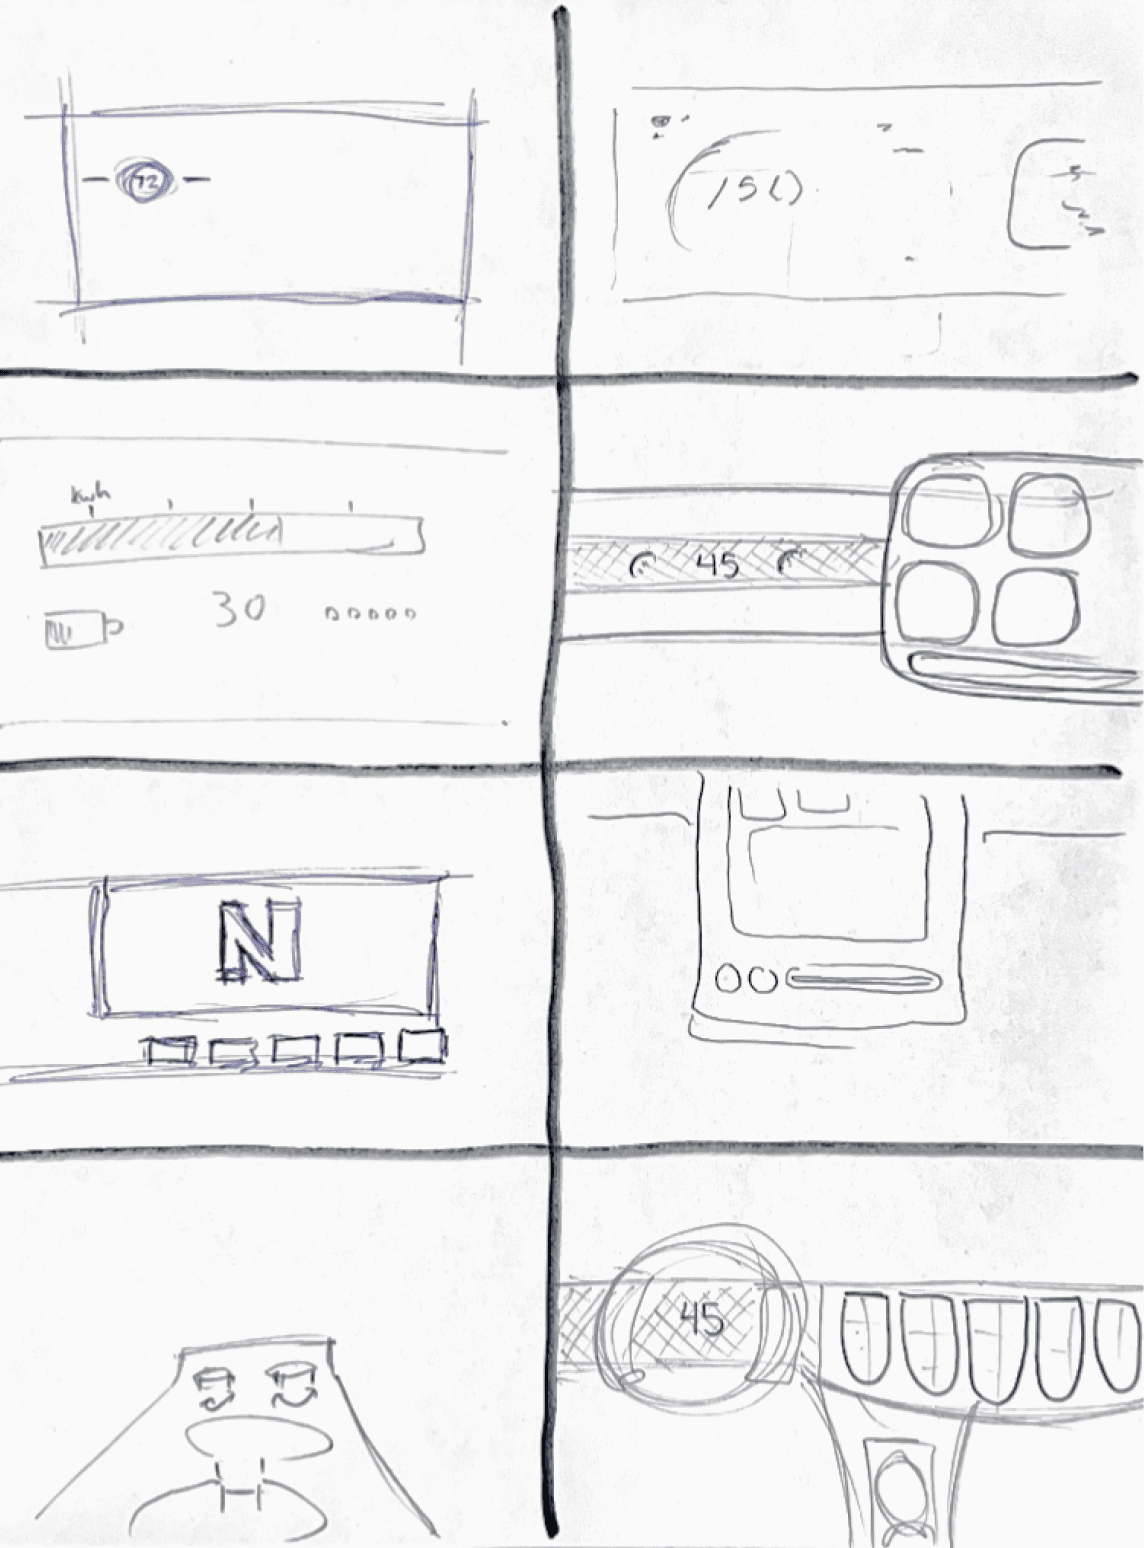
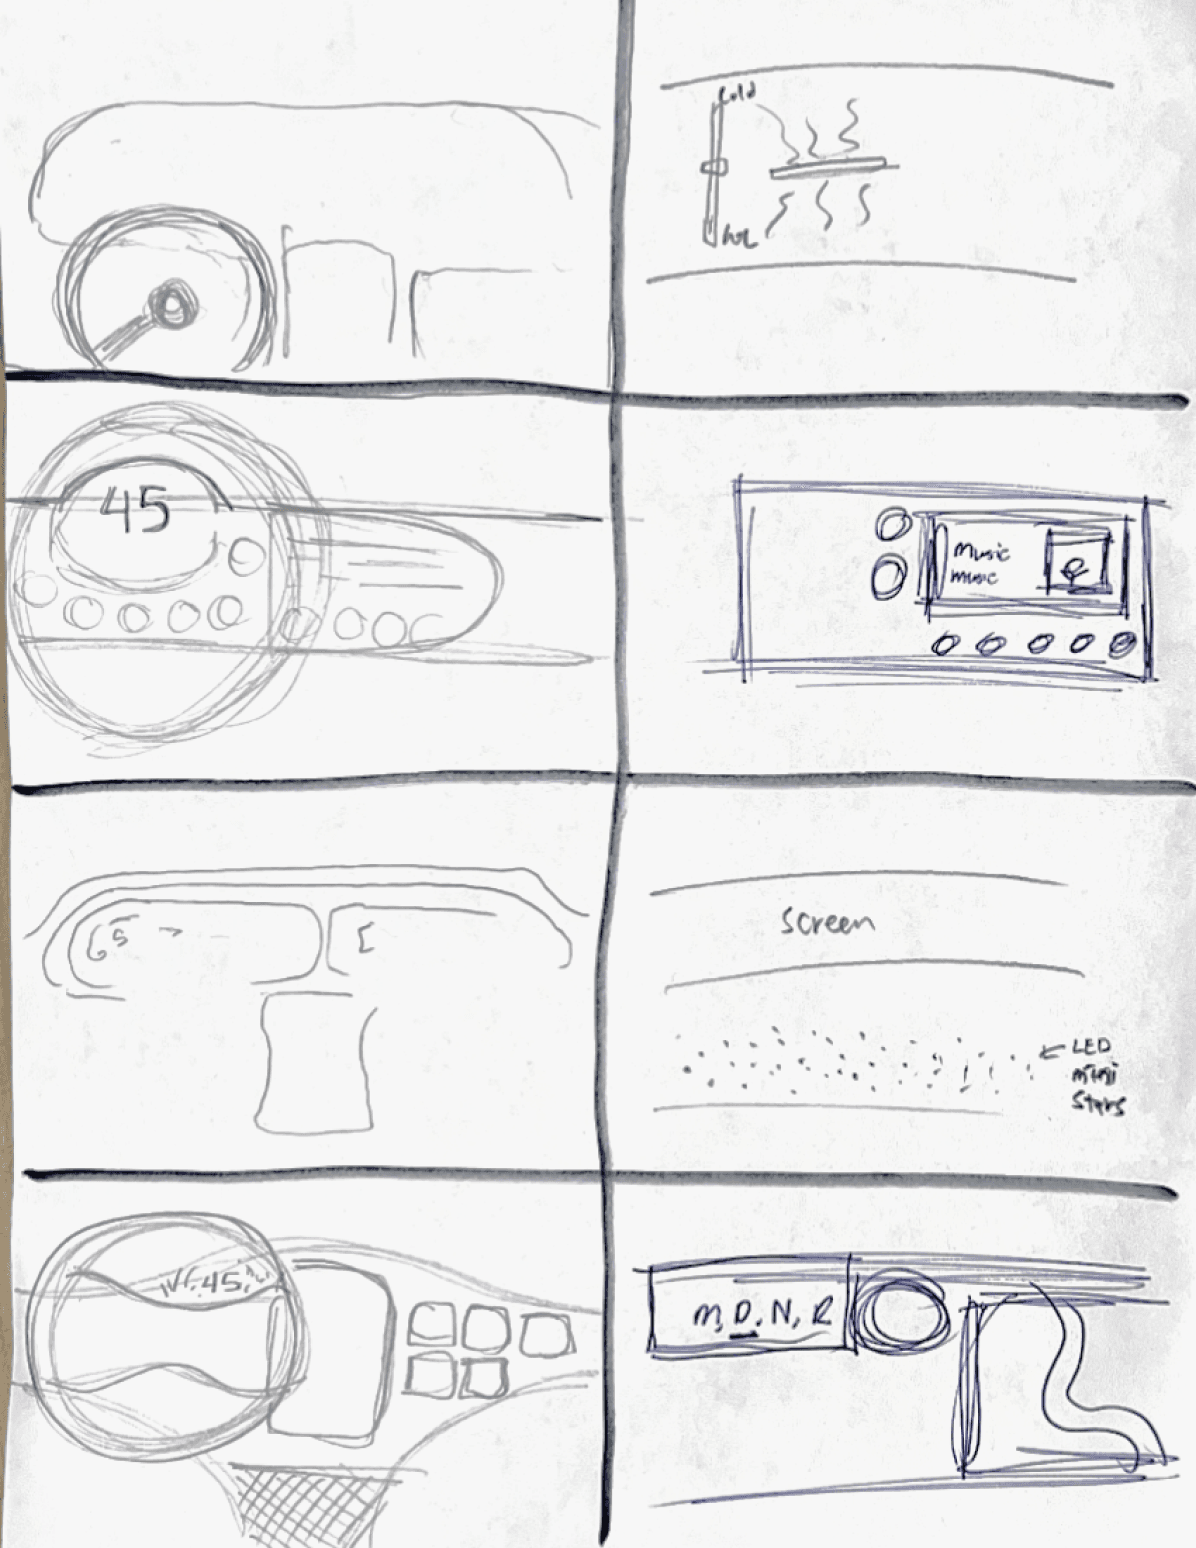
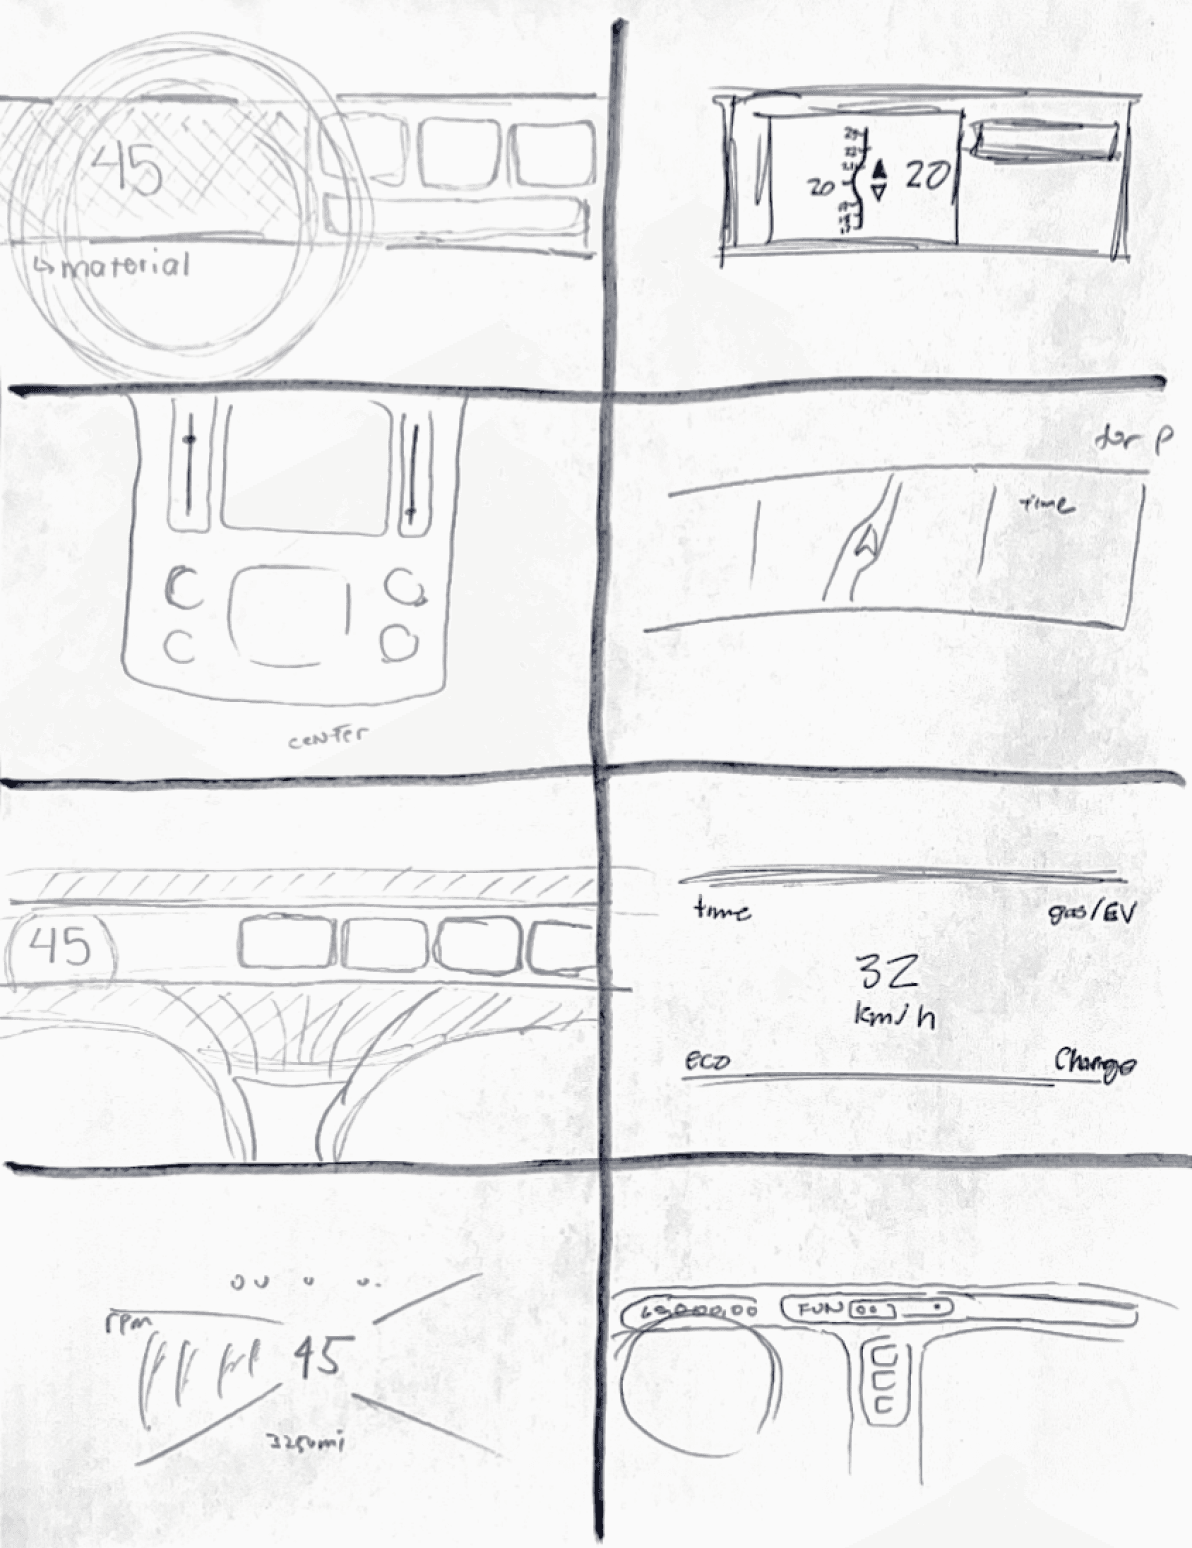
Wireframes
Insights from our observations directly shaped our wireframes and low-fidelity testing. By identifying user pain points, we focused on building trust, clarity, and ease of use through intuitive interactions, clear feedback, and accessible controls.

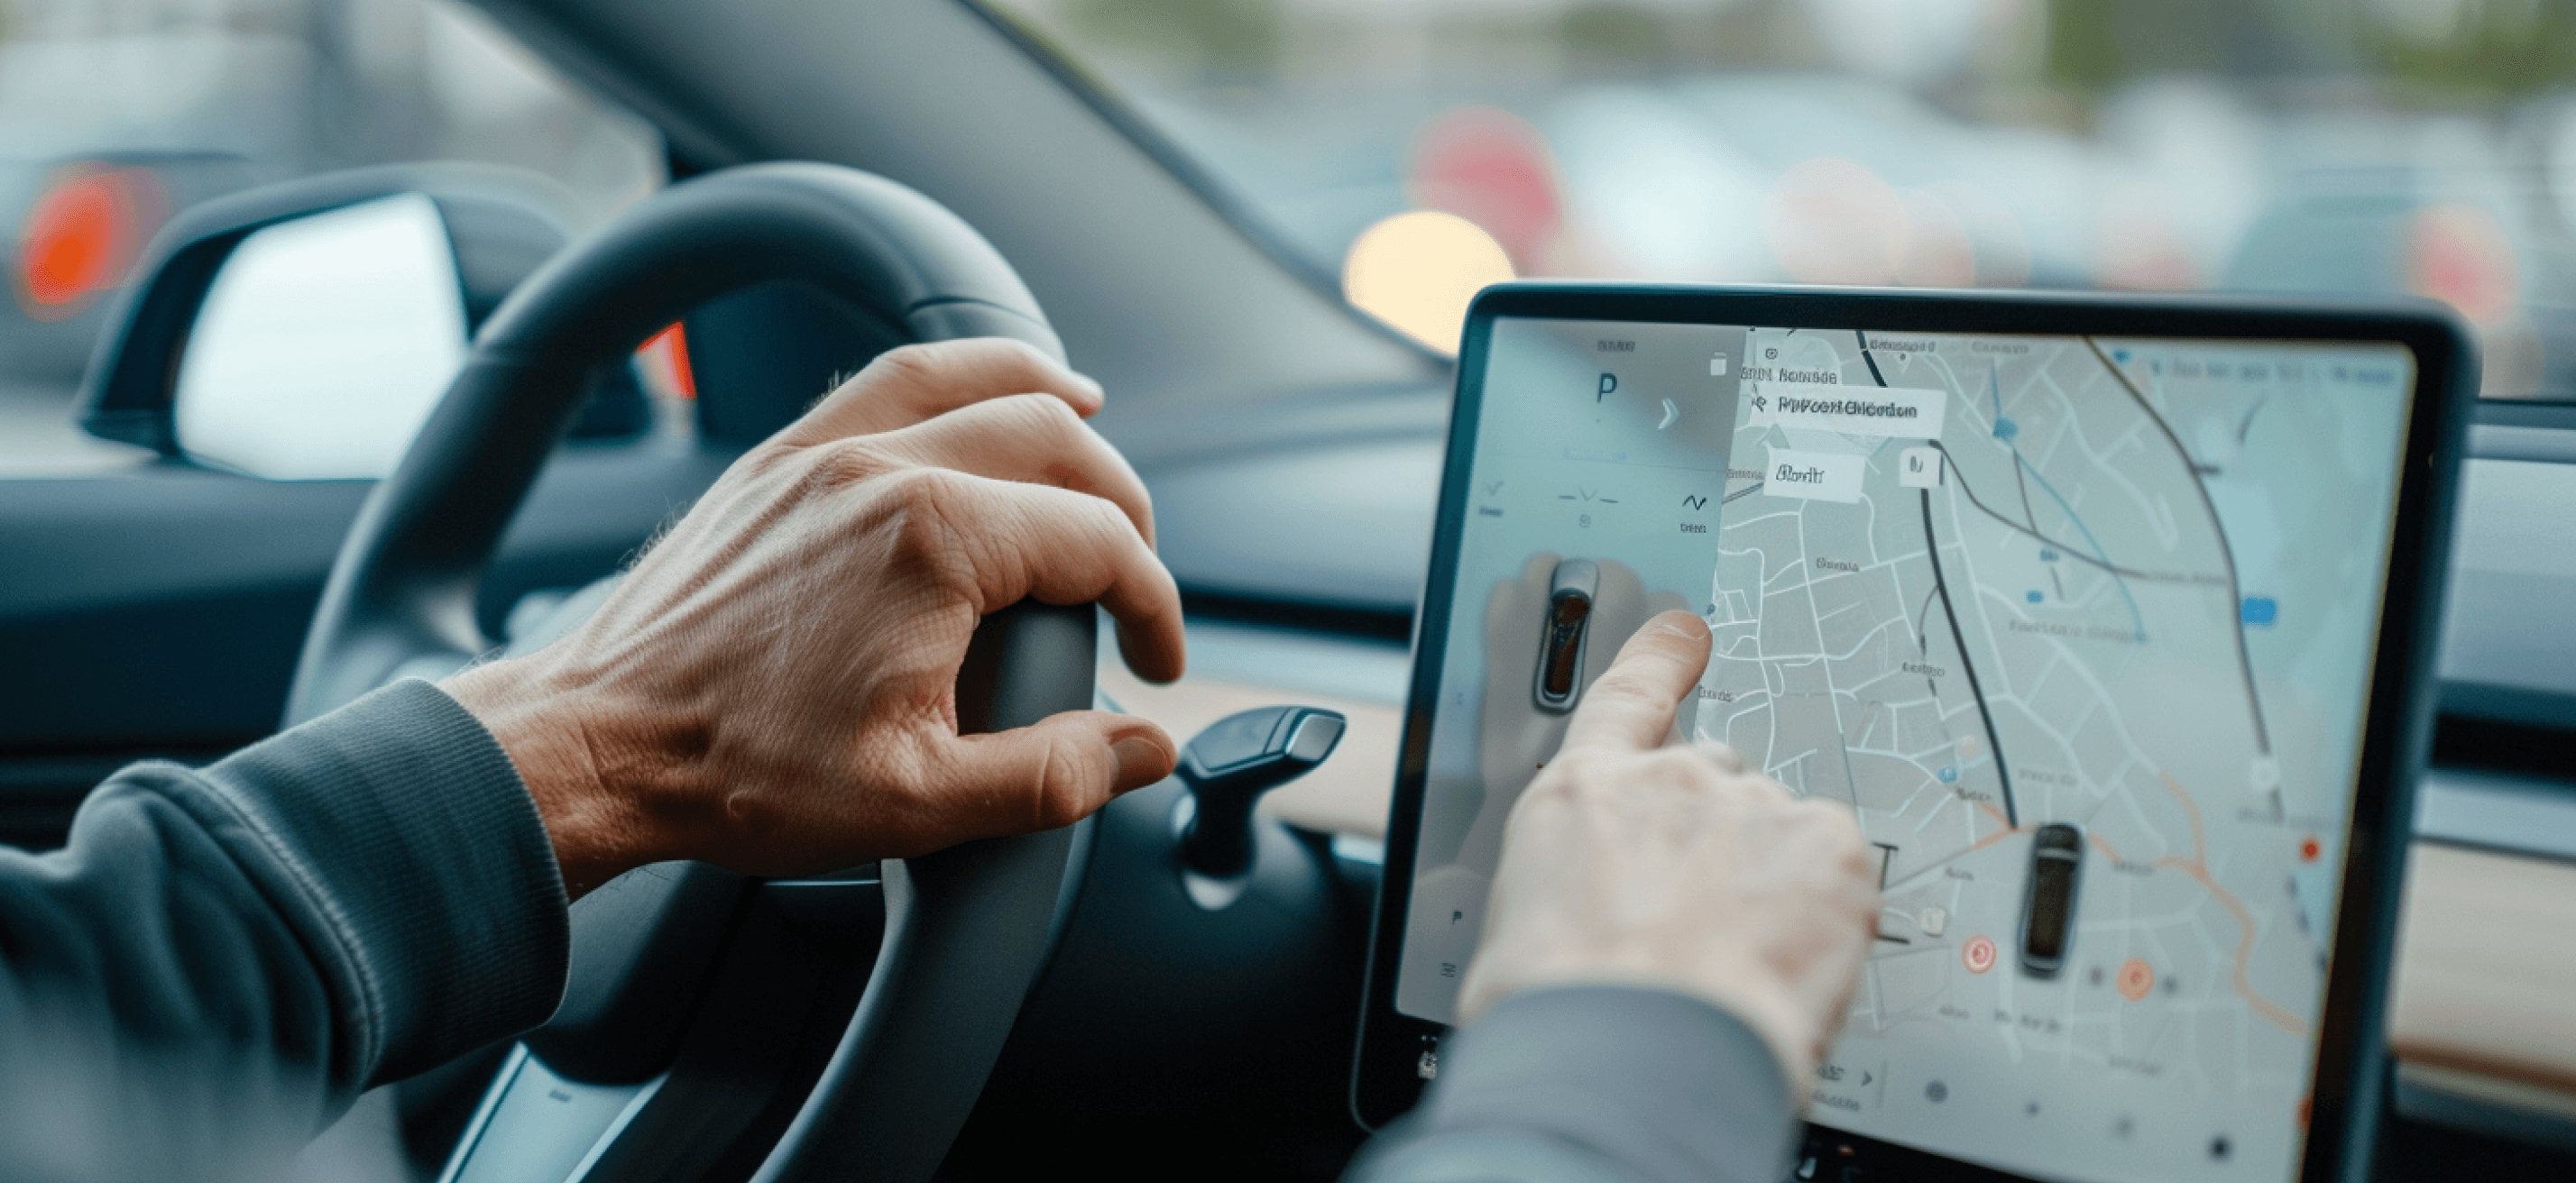
Flows
We mapped how AV drivers and manufacturers interact with the system—from monitoring vehicle behavior to understanding decision-making processes. Visualizing these flows helped define essential features, highlight design gaps, and support clear, intuitive interactions that build user trust and understanding.
Highlights confidence levels
Option to give feedback
Trip ends summary available
Timeline shows key AV actions
Tap to view decision rationale
Post-Trip Review
AV performs maneuver
“Lane change complete”
AV detects slower vehicle ahead
“Changing lanes to maintain speed”
Visual shows lane change path
Understanding an AV Maneuver
Countdown to resume
“Resuming obstacle cleared”
AV detects pedestrian
“Pedestrian ahead”
AV auto-brakes
Pedestrian Response
Mid-Fidelity Wireframes
We built mid-fidelity wireframes to visualize key interactions and refine layout, clarity, and usability before advancing to high-fidelity design.


Visual Identity
Primary Typography
Aa
BC Novatica CYR
Medium
20pt
18pt
16pt
16pt
BC Novatica CYR - Bold
BC Novatica CYR - Semi-Bold
BC Novatica CYR - Medium
BC Novatica CYR - Bold
Heading 01
Heading 02
Body
Numbers
Brand Colors
#000000
#4472f5
#e1e1e1
#F4F4F4
#ffffff
Readability/Scalability
As the brand body fonts are san serif, having a san serif logo keeps the branding cohesive. This keeps the brand experience consistent.
The logo is designed with different placements in mind. This helps with brand awareness across communication platforms.
User Testing
We used Maze to test usability and design, gathering feedback that revealed pain points, validated decisions, and guided targeted improvements.

Post Testing Iterations
Based on insights from Maze testing, we implemented targeted updates to enhance the overall experience. This included improving usability, fine-tuning visual elements, and addressing key pain points to ensure the interface felt more seamless, intuitive, and user-friendly.


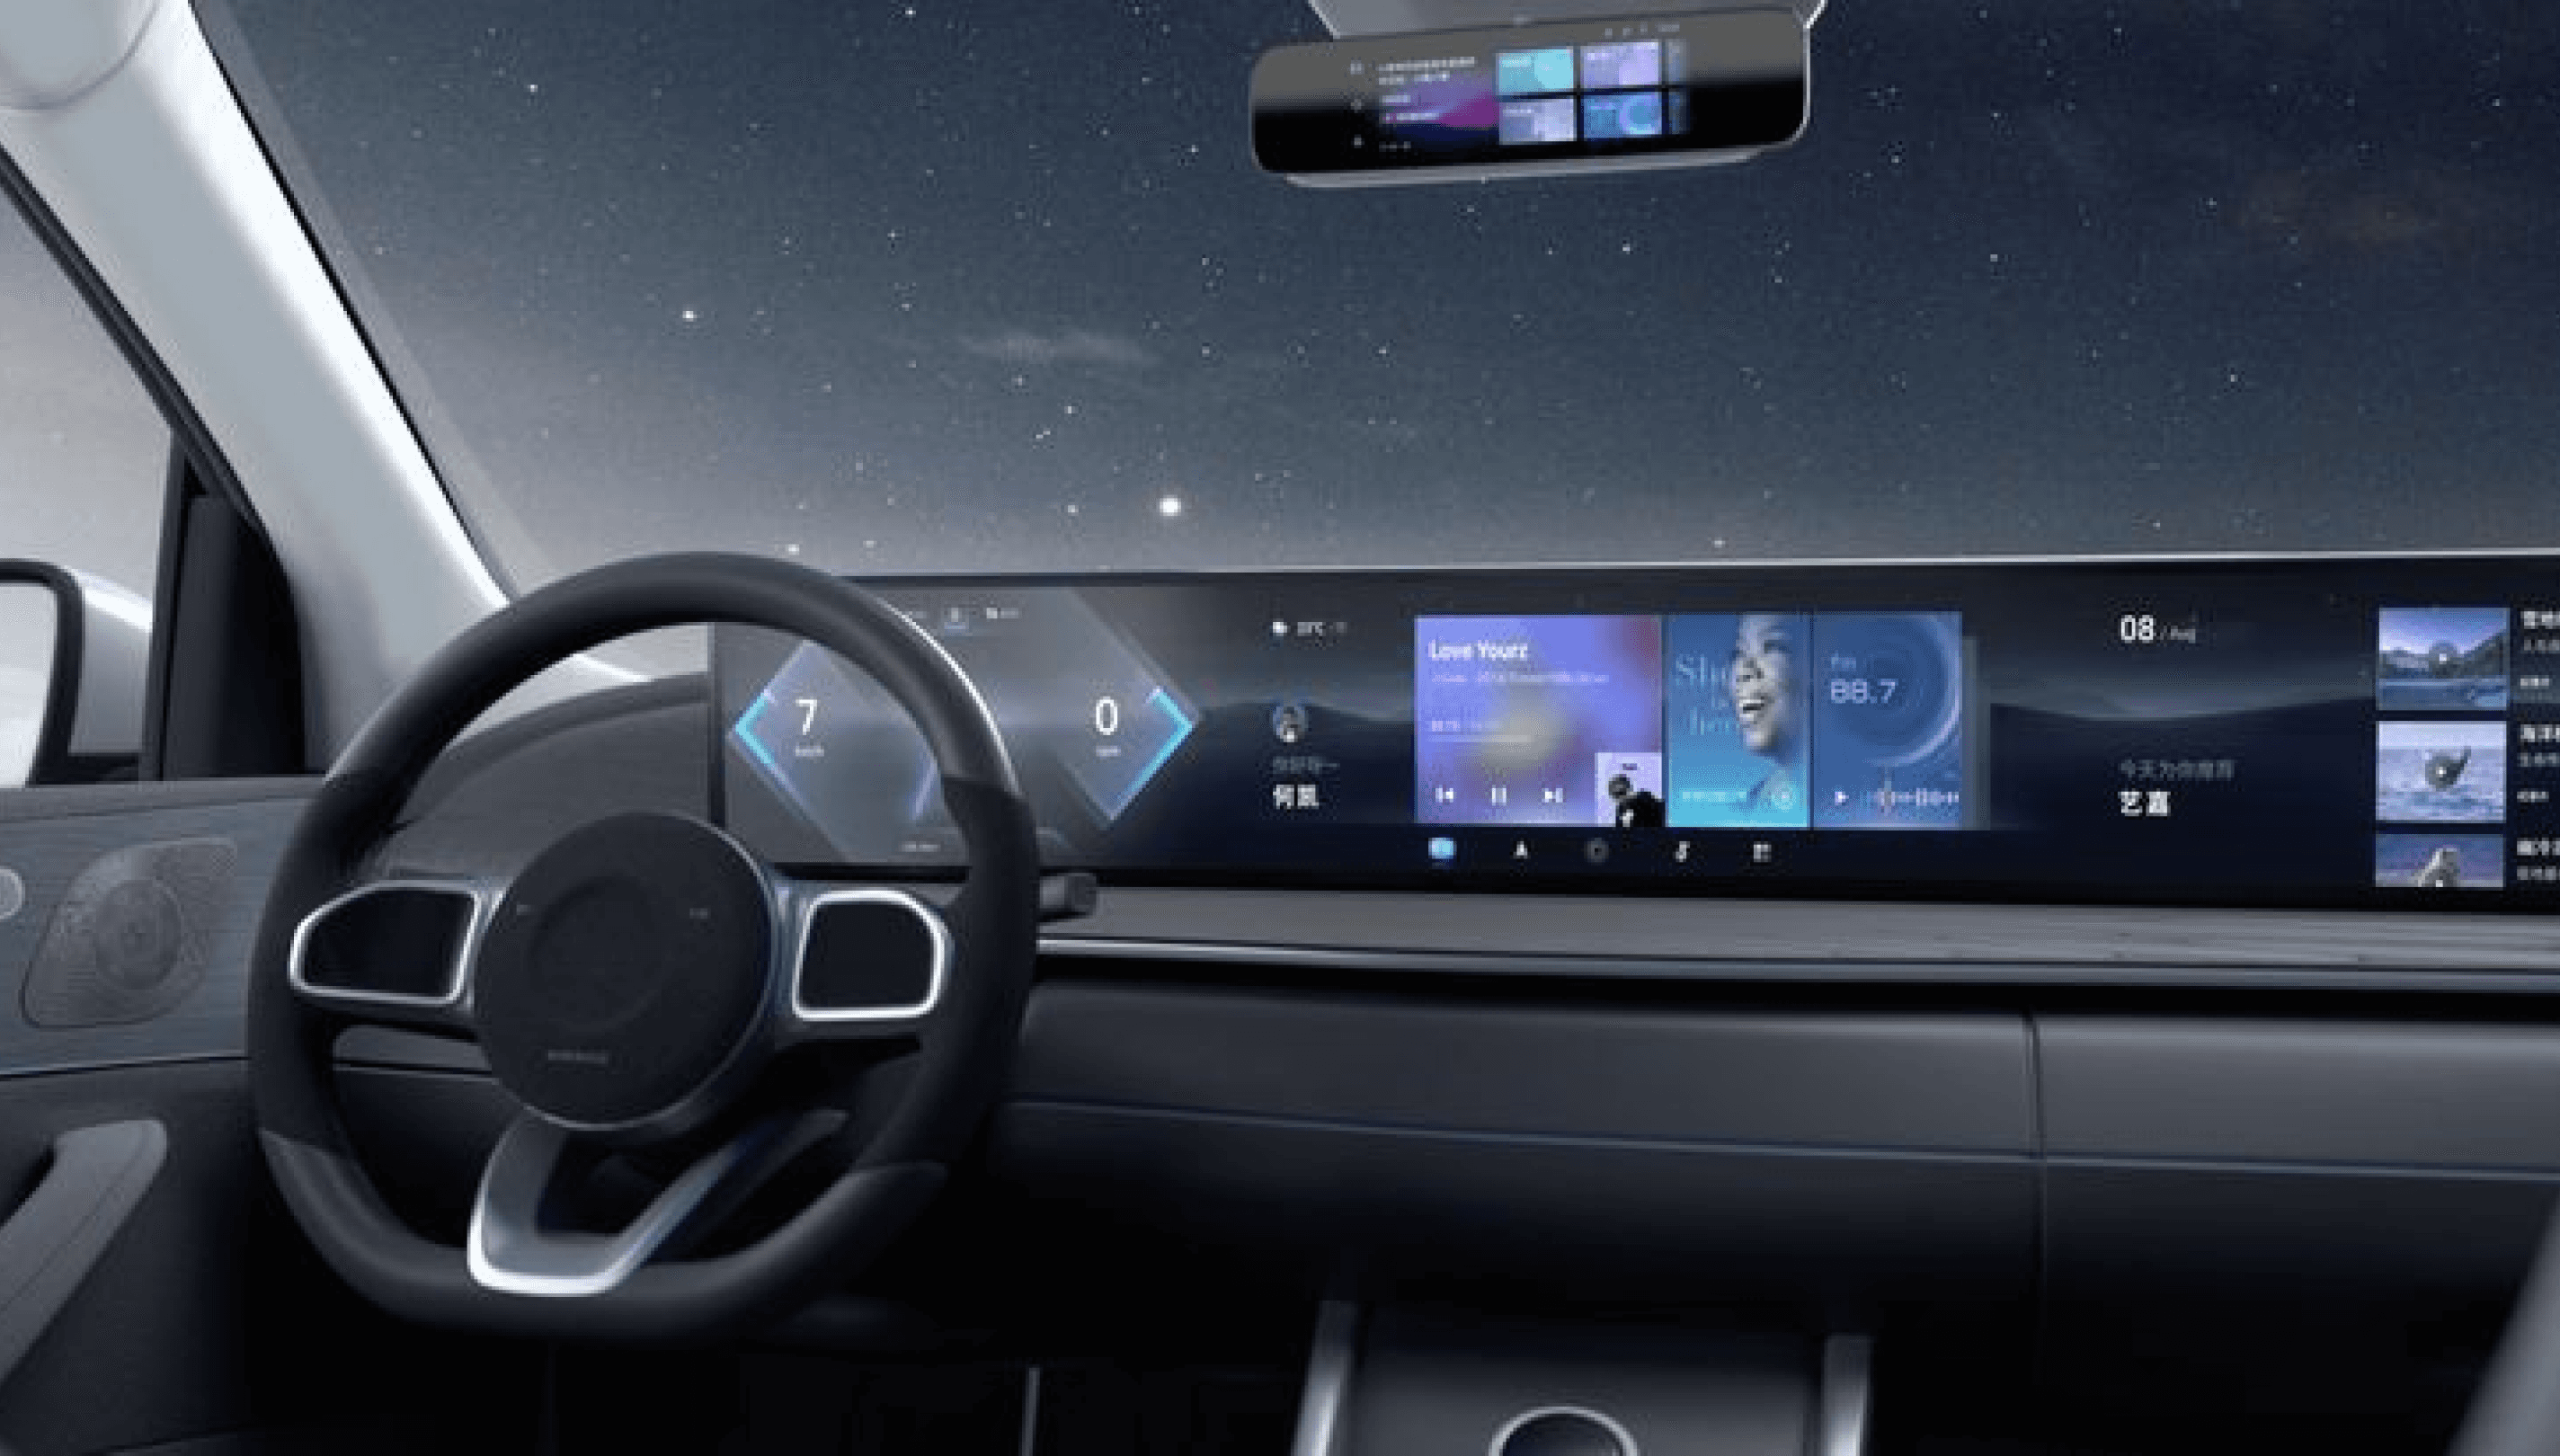
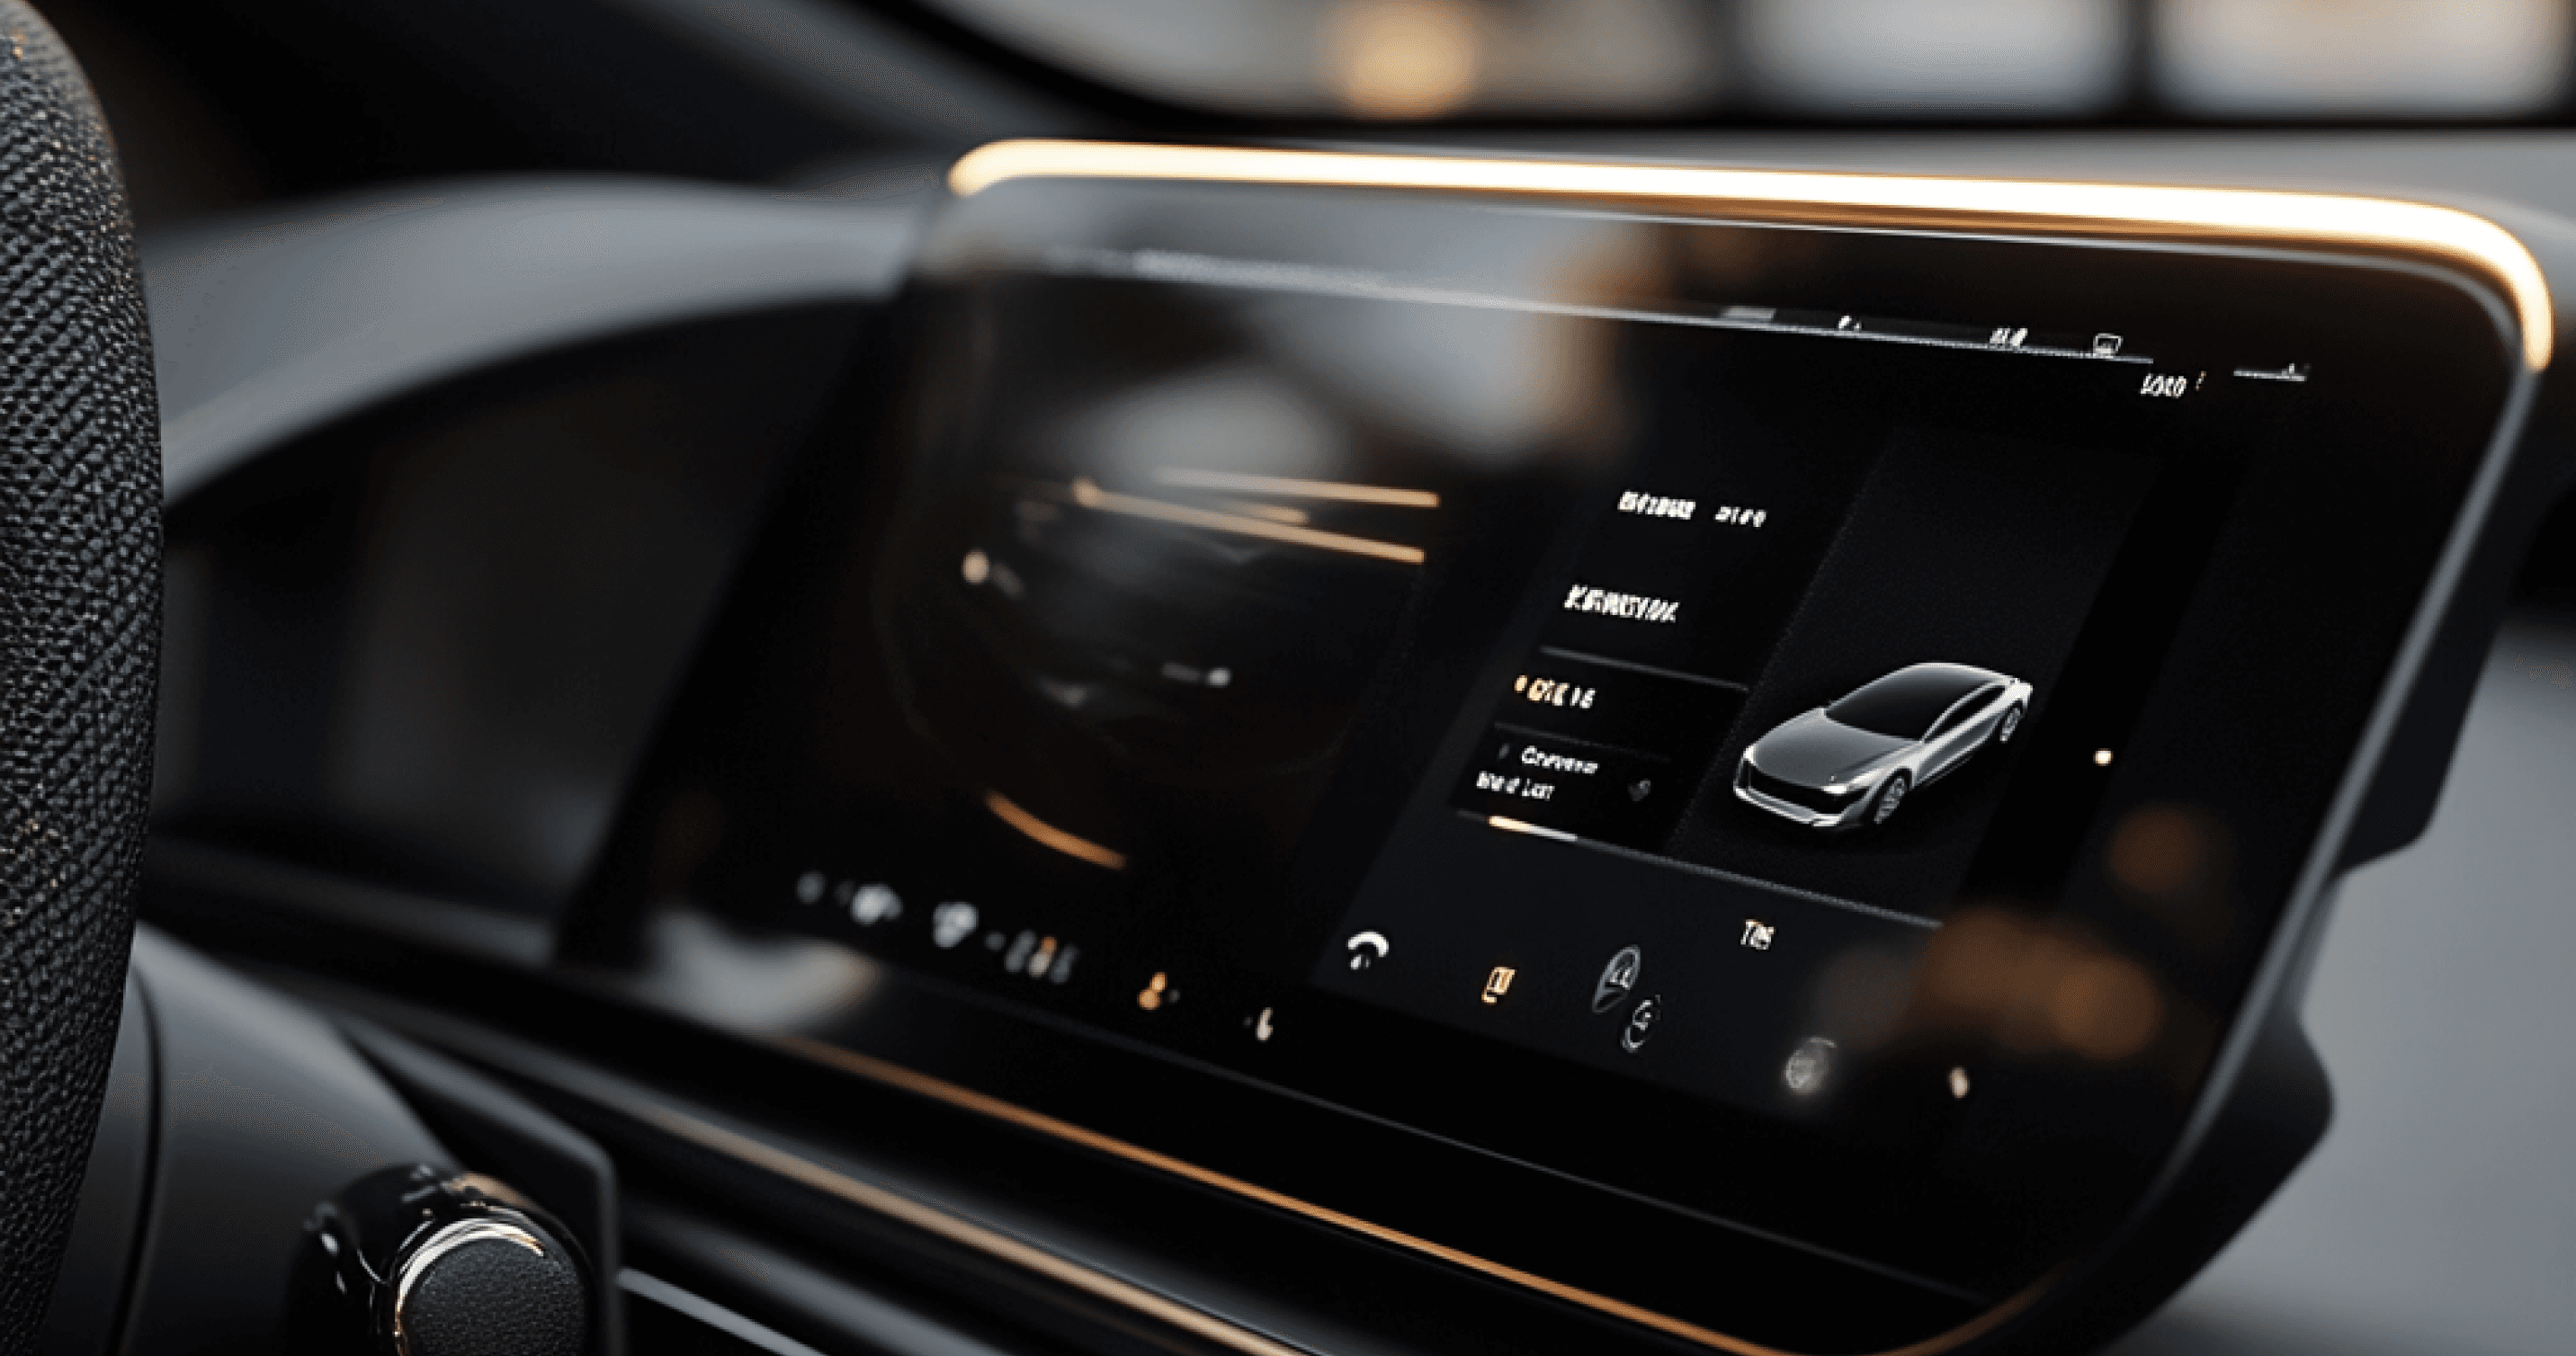
Final Screens


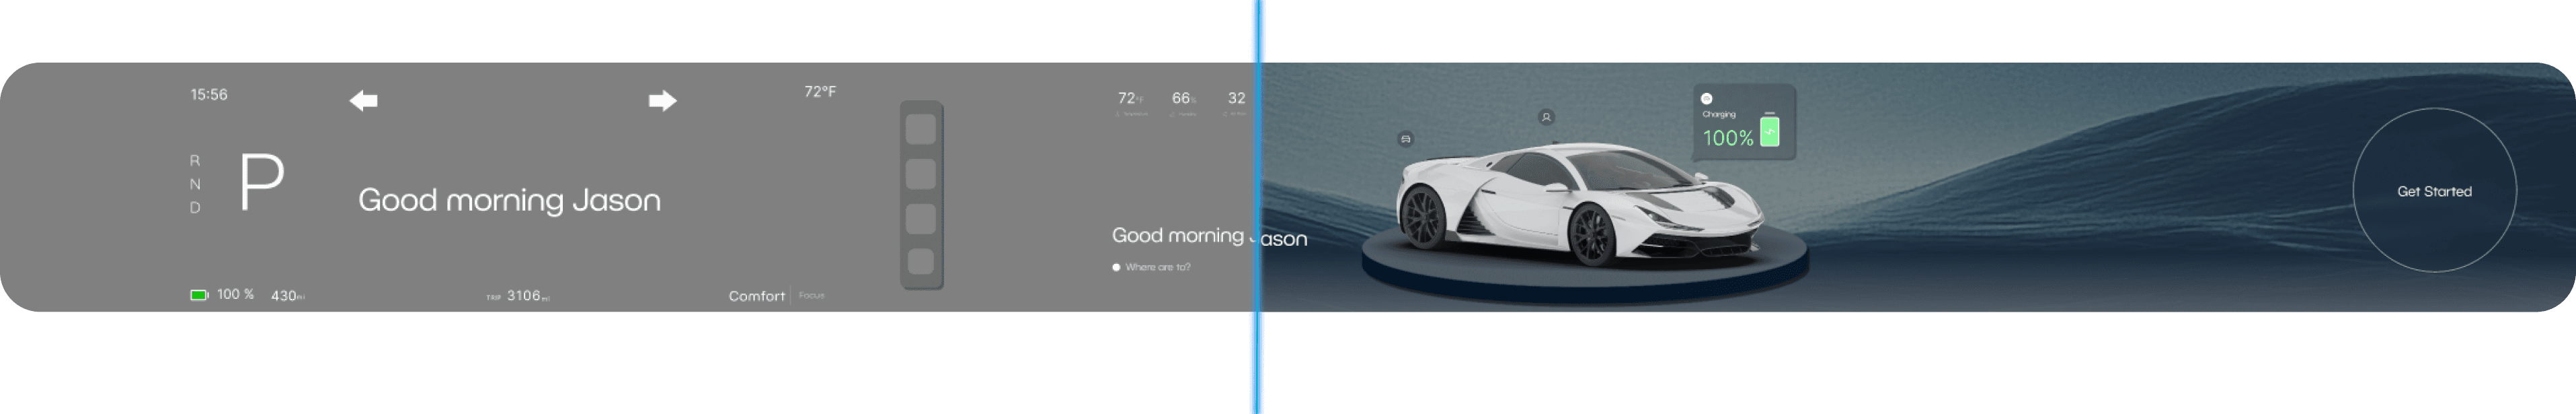
Start Up
The Startup Screen provides a clear, welcoming overview of the AV system. With quick access to vehicle status, user profile, and trip details, it orients users immediately. Whether beginning a drive or reviewing recent activity, this screen sets a confident tone from the first interaction.


Relax Mode
The Relax Mode Screen transforms downtime into an enjoyable experience during autonomous driving. Users can choose from activities like watching movies, browsing media, or listening to music—all while staying subtly connected to the vehicle’s status.


Focus Mode
The Focus Mode Screen supports users who want to stay closely engaged with the AV’s behavior. It highlights real-time driving data, upcoming maneuvers, and system decisions in a clear, distraction-free layout.


Cruise Mode
Cruise Mode lets users sit back and enjoy extended periods of entertainment during long trips. With easy access to movies, music, and other media, this mode prioritizes comfort and relaxation while keeping users subtly informed about the vehicle’s status and progress.
Integrated Features
Quick Interactions
Visual Cues / Path Previews
System Transparency
Trust Indicators
Contextual Alerts
Human-Centered Design
Touch-Friendly
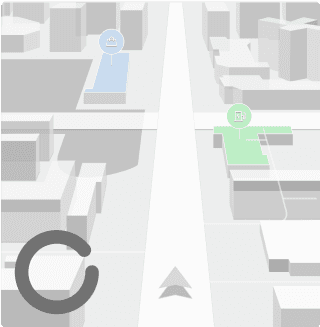
Path Preview
We integrated real-time path previews with estimated time of arrival (ETA) indicators to keep users informed about both the vehicle’s planned route and timing.
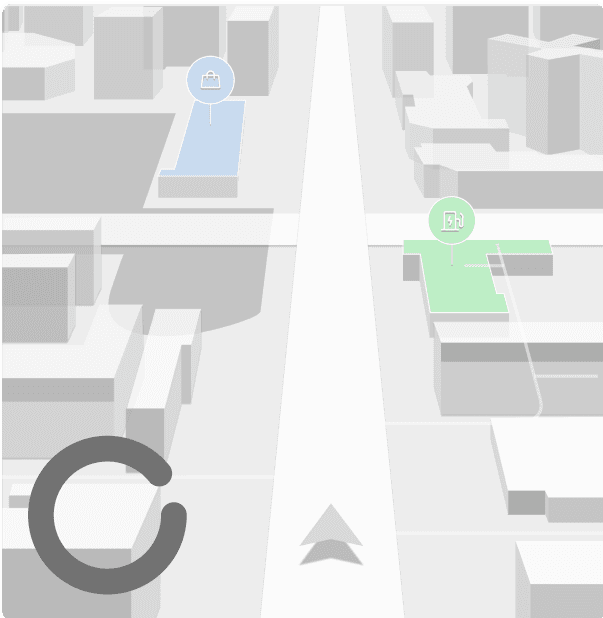
ETA
6:45pm
Distance
5.0 mi
Time
20 min
Quick Interactions
To support safe and efficient use in dynamic environments, we prioritized quick interactions throughout the interface. Key functions are accessible with minimal taps or gestures, allowing users to understand and respond to vehicle behavior instantly.
Trust Indicators
We added trust indicators to show the AV’s confidence in real-time decisions. Using subtle visual cues, users can quickly gauge how certain the system is, helping build transparency and confidence without adding complexity.

Contextual Alerts
We designed contextual alerts to provide timely, relevant updates such as notifying users when a pedestrian is about to cross. These alerts go beyond basic warnings by explaining why the AV is reacting..
Human-Centered Design
Our design approach focused on real user needs—prioritizing clarity, comfort, and control. By incorporating feedback from AV drivers and manufacturers, we created an interface that feels intuitive, supports understanding, and builds trust in the vehicle’s behavior.
Piano Sonata No. 14
Ludwig van Beethoven
Beethoven: The Piano Sonatas
72°F
Sunny
Rosslyn, VA
United States
Schedule
Monday, June 2nd, 2025
10 AM
Pick up order from Coffee Roasters
11 AM
Client meeting
12 PM
1 PM
Pick up Heidi
Lunch at Brewster’s
2 PM
3 PM

ETA
6:45pm
Distance
5.0 mi
Time
20 min
System Transparency
We prioritized system transparency by making the AV’s decisions and reasoning visible to users. Through clear visuals, explanations, and feedback, users can understand what the vehicle is doing and why, fostering trust and reducing uncertainty in autonomous behavior.
for 1.4 miles
SCHOOL
ZONE
15
Touch Friendly
We designed the interface with large, easy-to-tap elements and minimal input steps to support quick, safe interaction. This ensures users can navigate and respond comfortably, even in motion or high-focus driving environments.

mph
10
3106
TRIP
mi
97 %
430
mi
15:56
72°F
100
mi
left on Main St.
D
P
R
N
Piano Sonata No. 14
Ludwig van Beethoven
Beethoven: The Piano Sonatas
0:30
-3:23
Piano Sonata No. 14
Ludwig van Beethoven
Beethoven: The Piano Sonatas
72°F
Sunny
Rosslyn, VA
United States
Schedule
Monday, June 2nd, 2025
10 AM
Pick up order from Coffee Roasters
11 AM
Client meeting
12 PM
1 PM
2 PM
3 PM
ETA
6:45pm
Distance
5.0 mi
Time
20 min
N
NE
NW
100
mi
left on Main St.
Process Book
Want to know more ? Learn how our project came to be!
view
Similar projects to this

Lets Work Together
get in touch
