+1023
Raw Data Points From Survey’s and Interview’s
SCAD
2024-2025
Project Overview:
Ports are vital to the global economy, so safe, efficient energy management is key. COAST uses AI to help U.S. seaports optimize energy use, letting them focus on connecting the global economy to consumers.
Team:
Nick Pratt, Pingyao Wan, Krishna Aggarwal,
Mackey, Emiliano Resendez


Role
UI Designer
Duration
20 Weeks
Year
2024- 2025
Responsibilities
Wireframing, Design Systems, Prototyping, etc.
our goal...
To create an innovative power solution that allows seaports to control their energy, leading to higher productivity, lower costs, and lower emissions.
My Role
Throughout the project, I was deeply involved in every stage, with a focus on translating insights into clear, actionable design solutions.
As the UI and Visual Design Lead, I led the creation of layouts, design systems, and final visuals ensuring that each screen was both user-friendly and visually cohesive.
The Problem
U.S. seaports continue to rely on environmentally harmful practices such as gasoline-powered vehicles and equipment and face uncertainty about how to begin transitioning to electric alternatives in their daily operations.
Research Plan
How research and data guided our product decisions
2
Observation
30
Interviews
Secondary
Primary
95
Articles
+100
Survey Responses


Child Mind Institute
Science
https://childmind.org/article/understanding-dysgraphia
Separately, apart from these motor issues, there is a cognitive side to dysgraphia. The cognitive challenges include struggling with spelling, grammar, punctuation, sentence structure, and overall written expression. A child with dysgraphia might have a hard time translating their ideas onto paper.
Insight
National Library of Medicine
Science
https://pmc.ncbi.nlm.nih.gov/articles/PMC7082241
Writing is a complex task that is vital to learning and is usually acquired in the early years of life. ‘Dysgraphia’ and ‘specific learning disorder in written expression’ are terms used to describe those individuals who, despite exposure to adequate instruction, demonstrate writing ability discordant with their cognitive level and age. Dysgraphia can present with different symptoms at different ages.
Insight
New York Times
Education
https://nylag.org/the-new-york-times-struggling-teenagers-left-out-in-new-push-to-overhaul-reading
Students with dyslexia have trouble looking at the written word and blending the sounds into language. The city has rolled out universal screening to help identify these children in elementary grades, officials said. But few older students have been assessed.
Insight
Physical Therapy
https://www.frontiersin.org/journals/psychology/articles/10.3389/fpsyg.2018.02006
Developmental dysgraphia is a disorder of writing/spelling skills, closely related to developmental dyslexia. For developmental dyslexia, profiles with a focus on phonological, attentional, visual or auditory deficits have recently been established. Unlike for developmental dyslexia, however, there are only few studies about dysgraphia, in particular about the variability of its causes. Research has demonstrated high similarity between developmental dyslexia and dysgraphia.
Insight
Child Mind Institute
Science
https://childmind.org/article/understanding-dysgraphia
Separately, apart from these motor issues, there is a cognitive side to dysgraphia. The cognitive challenges include struggling with spelling, grammar, punctuation, sentence structure, and overall written expression. A child with dysgraphia might have a hard time translating their ideas onto paper.
Insight
New York Times
Education
https://childmind.org/article/understanding-dysgraphia
Separately, apart from these motor issues, there is a cognitive side to dysgraphia. The cognitive challenges include struggling with spelling, grammar, punctuation, sentence structure, and overall written expression. A child with dysgraphia might have a hard time translating their ideas onto paper.
Insight


Child Mind Institute
Science
https://childmind.org/article/understanding-dysgraphia
Separately, apart from these motor issues, there is a cognitive side to dysgraphia. The cognitive challenges include struggling with spelling, grammar, punctuation, sentence structure, and overall written expression. A child with dysgraphia might have a hard time translating their ideas onto paper.
Insight
National Library of Medicine
Science
https://pmc.ncbi.nlm.nih.gov/articles/PMC7082241
Writing is a complex task that is vital to learning and is usually acquired in the early years of life. ‘Dysgraphia’ and ‘specific learning disorder in written expression’ are terms used to describe those individuals who, despite exposure to adequate instruction, demonstrate writing ability discordant with their cognitive level and age. Dysgraphia can present with different symptoms at different ages.
Insight
New York Times
Education
https://nylag.org/the-new-york-times-struggling-teenagers-left-out-in-new-push-to-overhaul-reading
Students with dyslexia have trouble looking at the written word and blending the sounds into language. The city has rolled out universal screening to help identify these children in elementary grades, officials said. But few older students have been assessed.
Insight
Physical Therapy
https://www.frontiersin.org/journals/psychology/articles/10.3389/fpsyg.2018.02006
Developmental dysgraphia is a disorder of writing/spelling skills, closely related to developmental dyslexia. For developmental dyslexia, profiles with a focus on phonological, attentional, visual or auditory deficits have recently been established. Unlike for developmental dyslexia, however, there are only few studies about dysgraphia, in particular about the variability of its causes. Research has demonstrated high similarity between developmental dyslexia and dysgraphia.
Insight
Child Mind Institute
Science
https://childmind.org/article/understanding-dysgraphia
Separately, apart from these motor issues, there is a cognitive side to dysgraphia. The cognitive challenges include struggling with spelling, grammar, punctuation, sentence structure, and overall written expression. A child with dysgraphia might have a hard time translating their ideas onto paper.
Insight
New York Times
Education
https://childmind.org/article/understanding-dysgraphia
Separately, apart from these motor issues, there is a cognitive side to dysgraphia. The cognitive challenges include struggling with spelling, grammar, punctuation, sentence structure, and overall written expression. A child with dysgraphia might have a hard time translating their ideas onto paper.
Insight


NOAA Uncrewed Systems Strategy
Science
https://childmind.org/article/understanding-dysgraphia
Separately, apart from these motor issues, there is a cognitive side to dysgraphia. The cognitive challenges include struggling with spelling, grammar, punctuation, sentence structure, and overall written expression. A child with dysgraphia might have a hard time translating their ideas onto paper.
Insight
Sustainable Supply Chains
Science
https://pmc.ncbi.nlm.nih.gov/articles/PMC7082241
Writing is a complex task that is vital to learning and is usually acquired in the early years of life. ‘Dysgraphia’ and ‘specific learning disorder in written expression’ are terms used to describe those individuals who, despite exposure to adequate instruction, demonstrate writing ability discordant with their cognitive level and age. Dysgraphia can present with different symptoms at different ages.
Insight
New York Times
Education
https://nylag.org/the-new-york-times-struggling-teenagers-left-out-in-new-push-to-overhaul-reading
Students with dyslexia have trouble looking at the written word and blending the sounds into language. The city has rolled out universal screening to help identify these children in elementary grades, officials said. But few older students have been assessed.
Insight
Physical Therapy
https://www.frontiersin.org/journals/psychology/articles/10.3389/fpsyg.2018.02006
Developmental dysgraphia is a disorder of writing/spelling skills, closely related to developmental dyslexia. For developmental dyslexia, profiles with a focus on phonological, attentional, visual or auditory deficits have recently been established. Unlike for developmental dyslexia, however, there are only few studies about dysgraphia, in particular about the variability of its causes. Research has demonstrated high similarity between developmental dyslexia and dysgraphia.
Insight
Renewable Energy
Science
https://childmind.org/article/understanding-dysgraphia
Separately, apart from these motor issues, there is a cognitive side to dysgraphia. The cognitive challenges include struggling with spelling, grammar, punctuation, sentence structure, and overall written expression. A child with dysgraphia might have a hard time translating their ideas onto paper.
Insight
New York Times
Education
https://childmind.org/article/understanding-dysgraphia
Separately, apart from these motor issues, there is a cognitive side to dysgraphia. The cognitive challenges include struggling with spelling, grammar, punctuation, sentence structure, and overall written expression. A child with dysgraphia might have a hard time translating their ideas onto paper.
Insight
95 Articles
Analyzed
We reviewed a range of academic and industry articles, including
peer-reviewed studies and expert reports. Each source was selected for its credibility, relevance to port operations, and the depth of insight into energy systems, infrastructure, and emerging technologies.
Insights
After analyzing the articles, we synthesized key insights, compelling data, and powerful quotes that shaped our initial understanding and guided our approach to the problem
$2.89 trillion
in American economic activity
90%
of world trade is carried out by sea

Main Insight
Many U.S. seaports lack systems to track their current fuel consumption and energy usage, making it difficult to identify inefficiencies or plan a transition to electric alternatives. Without clear visibility into their energy baseline, port operators are unable to make informed decisions or measure the impact of sustainable upgrades.
Survey
To support our secondary research, we surveyed over 100 participants including port operators, logistics staff, and industry professionals, to gather firsthand insights on energy awareness, operational challenges, and current transition strategies.
On a scale of 1–5, how confident are you in the accuracy of your current fuel/power data?
Type your response...
What tools, if any, do you use to monitor fuel or power consumption?
Type your response...
How aware are you of your port’s total energy usage on a weekly or monthly basis?
Type your response...
What percentage of your equipment and vehicles are gasoline- or diesel-powered?
Type your response...
Are any operations currently electrified? If yes, which ones?
Type your response...
Have you explored electric alternatives for any part of your operations?
Type your response...
Do you currently track fuel consumption across daily operations?
Type your response...
What are the biggest pain points in managing fuel-powered operations?
Type your response...
Interviews
We interviewed 30 participants including port professionals, operators, and energy coordinators to gain firsthand insights into daily operations, energy challenges, and views on sustainability transitions.
30
76%
24%
Interviewees
work as port operations, environmental, and energy managers
work as maintenance or on the field of the sea port
Problem Statement
U.S. seaports continue to rely on environmentally harmful practices such as gasoline-powered vehicles and equipment and face uncertainty about how to begin transitioning to electric alternatives in their daily operations.
Many U.S. seaports lack systems to track fuel and energy use, making it hard to identify inefficiencies or plan a transition to electric alternatives. Without clear energy data, operators struggle to make informed decisions or measure sustainability progress.
Target Audience

Operation Managers

Sustainability Directors

Infrastructure Monitoring Teams
Personas
We used insights from our primary research to develop detailed personas and an empathy map that accurately reflect our target audience
Achieve decarbonization targets set by national/international regulations
Transition to smart & renewable integration
Green-Driven
Increase energy efficiency across port systems
Ensure continuous uptime of port operations
Enterprise-level protection for sensitive operational data.
Intuitive for both technical teams and executive leadership.
BASELINES FOR US TO EXCEED
Industrial-grade hardware and systems built for 24/7 operation.
Goals
Built-in tools for environmental and regulatory reporting.
TARGETS FOR US TO MEET
Expectations
Director of Sustainability
Scope:

"I don’t just need to see where our energy is going; I need to really understand it, optimize it, and prove that we’re making progress.”
Strategic Leadership
Tech Adoption
Existing energy systems are fragmented and outdated
Position the port as future-ready.
Hard to pinpoint energy waste or spikes
Overwhelming feeling
Requires multi-system integration but lacks a unified dashboard
PITFALLS WE LOOK TO AVOID
Reduce emissions and meet environmental standards; show measurable progress toward climate goals.
Keep equipment and terminals running efficiently with no downtime or overspend on energy.
Pain Points
Limited visibility into real-time energy flow across massive infrastructure
POINTS FOR US TO RESONATE WITH
Motivations
Data Reliant
Oversees energy across terminals, facilities, and maritime equipment
Port of Savannah, Georgia
Location:
Steven Connors, 45
Sustainability Directors
Journey Map
Walking through a Sustainability Director’s day-to-day process revealed key emotional moments, actions, and breakdowns especially where lack of data and visibility made progress toward sustainability feel slow, frustrating, and uncertain.
Features
Requesting Data
Manual Compilation
Finding Inefficiencies
Building a Plan
Reporting Progress
Actions
Emails multiple departments.
Requests spreadsheets, logs, or manual reports.
Follows up multiple times for missing info.
Combines data from different formats.
Fixes inconsistent units
Spends hours cleaning and organizing data.
Tries to find trends in raw data.
Compares old logs to estimate fuel/electricity usage.
Makes assumptions without real-time data.
Drafts sustainability goals with limited data.
Tries to estimate ROI and emissions impact.
Pitches proposals to leadership without confidence.
Manually builds reports for stakeholders or grants.
Pulls together charts, summaries, and estimates.
Reviews reports repeatedly to catch errors.
“Why isn’t this centralized?”
“This should be easier to access.”
“How can I make decisions with gaps like this?”
“This is a mess.”
“I’m spending more time cleaning than analyzing.”
“There has to be a better way.”
“I know we’re wasting energy, but I can’t prove where.”
“This doesn’t show the full picture.”
“It’s hard to justify any changes like this.”
“This plan won’t hold up to tough questions.”
“I’m guessing more than I’d like to admit.”
“Leadership won’t invest in guesswork.”
“These numbers don’t tell the whole story.”
“This is taking way too long.”
“What if this data is questioned?”
Frustrated
Overwhelmed
Impatient
Drained
Stuck
Disheartened
Uncertain
Powerless
Skeptical
Anxious
Unconfident
Undermined
Stressed
Exposed
Insecure
Thoughts
Feelings

How might we...
create an innovative power solution that allows seaports to control their energy, leading to higher productivity, lower costs, and zero emissions?

Proposed Concept
An AI-powered insights platform designed to optimize sustainability strategies for all operational teams, while specifically supporting decision-makers by delivering real-time alerts and personalized recommendations that drive measurable ROI on existing green investments.
Ecosystem Map
COAST functions as an integrated energy intelligence network that brings infrastructure, data, and decision-making into a single loop. By translating real-time operations into actionable guidance, it helps ports run more efficiently while lowering energy costs and emissions.
Energy-hungry assets such as cranes, charging stations, and vehicle fleets
Processes live data to forecast demand and reveal inefficiencies.
Continuously learns from port activity to automate smarter energy decisions.
Delivers alerts and recommendations to guide smarter energy decisions.
Optimize live port activity by aligning energy use with workflow demands.
Sensor / Monitoring
Layer
AI Optimization
Engine
COAST Insights Platform
Infrastructure
& Equipment
Port Monitoring
Team
Wireframes
We developed detailed user scenarios based on the Sustainability Director’s workflow, highlighting where data gaps and inefficiencies occur. These insights shaped our wireframes, forming the foundation for low-fidelity testing and guiding our core design decisions.

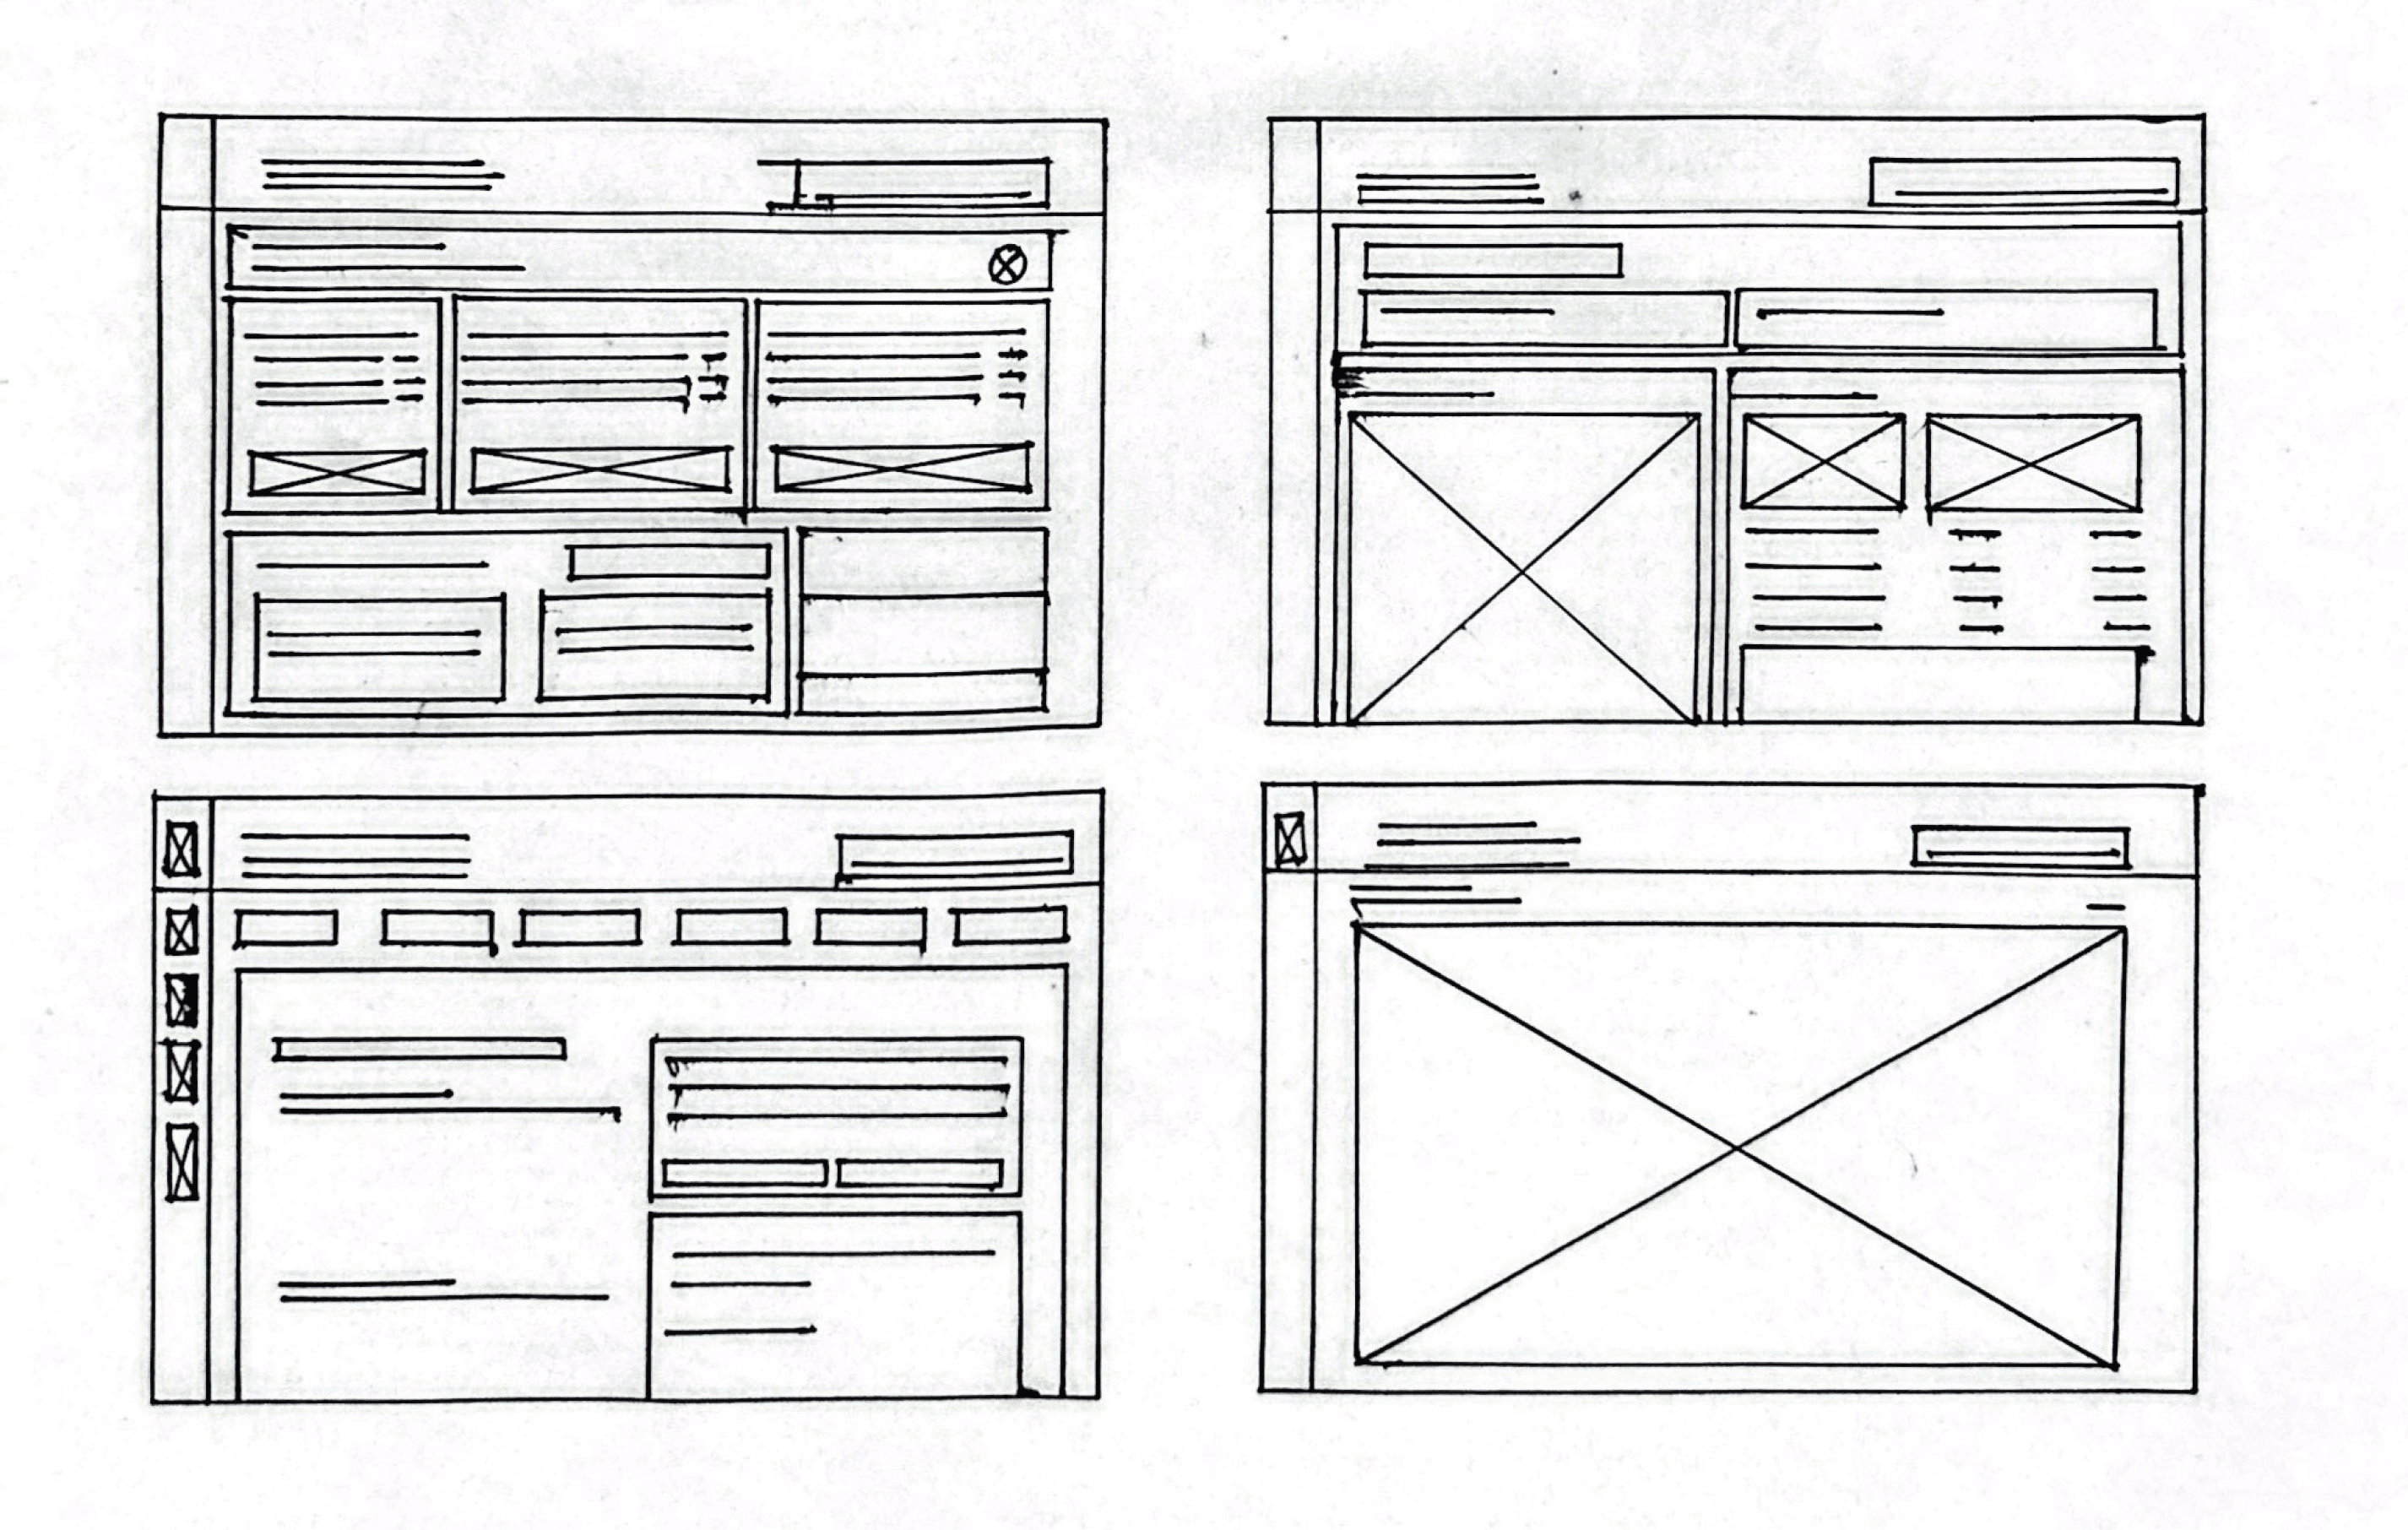
Flows
These flows helped us map how Sustainability Directors would interact with the system from accessing energy data to generating reports. Visualizing these steps allowed us to define core functionality, uncover design gaps, and build a strong foundation for prototyping the dashboard experience.
Identify spikes or patterns
Login to Dashboard
Select Terminal/ Department
View real-time usage data
Daily
Weekly
Monthly
Viewing Real-Time Energy & Fuel Usage
Add optional notes or custom data
Export as PDF or share via link
Navigate to “Reports” section
Select reporting period and metrics
Auto-generate summary
Generating a Sustainability Report
Select candidates for electrification
Generate projected impact
Access Optimization tab
View list of current powered assets
Usage
Cost
Emissions per Asset
Planning Electrification Upgrades
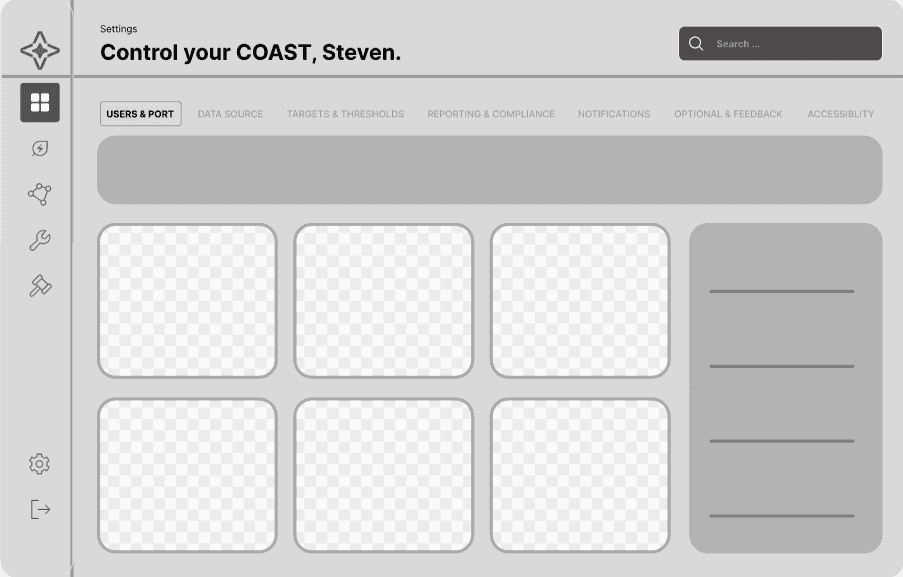
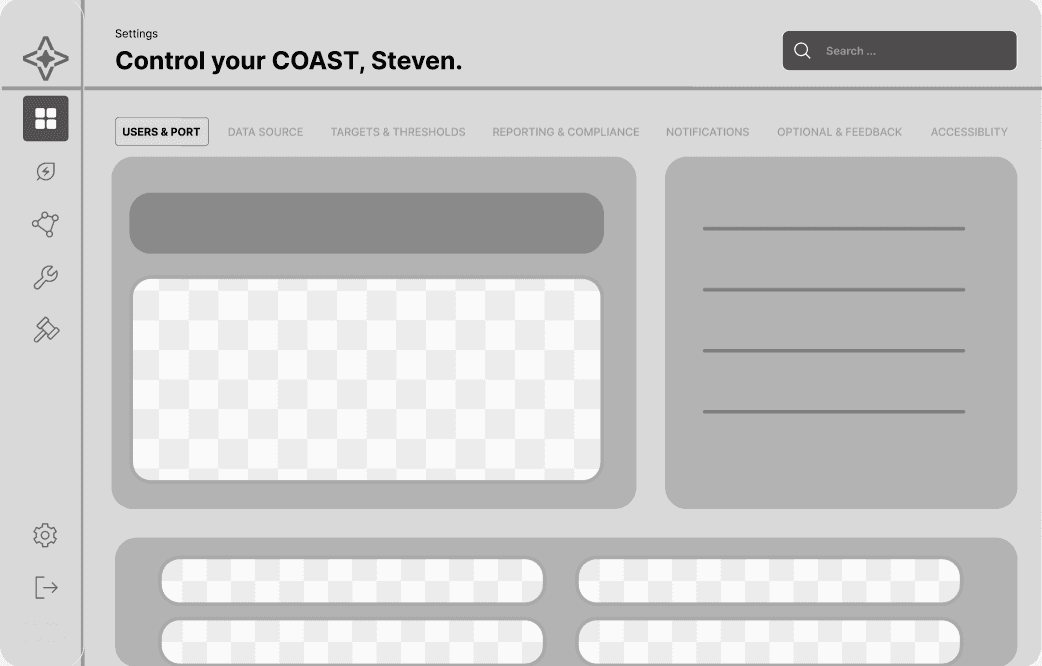
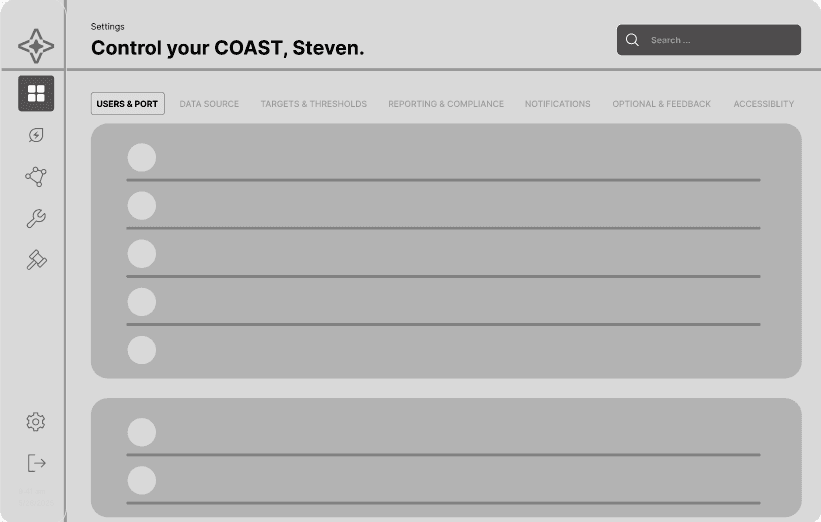
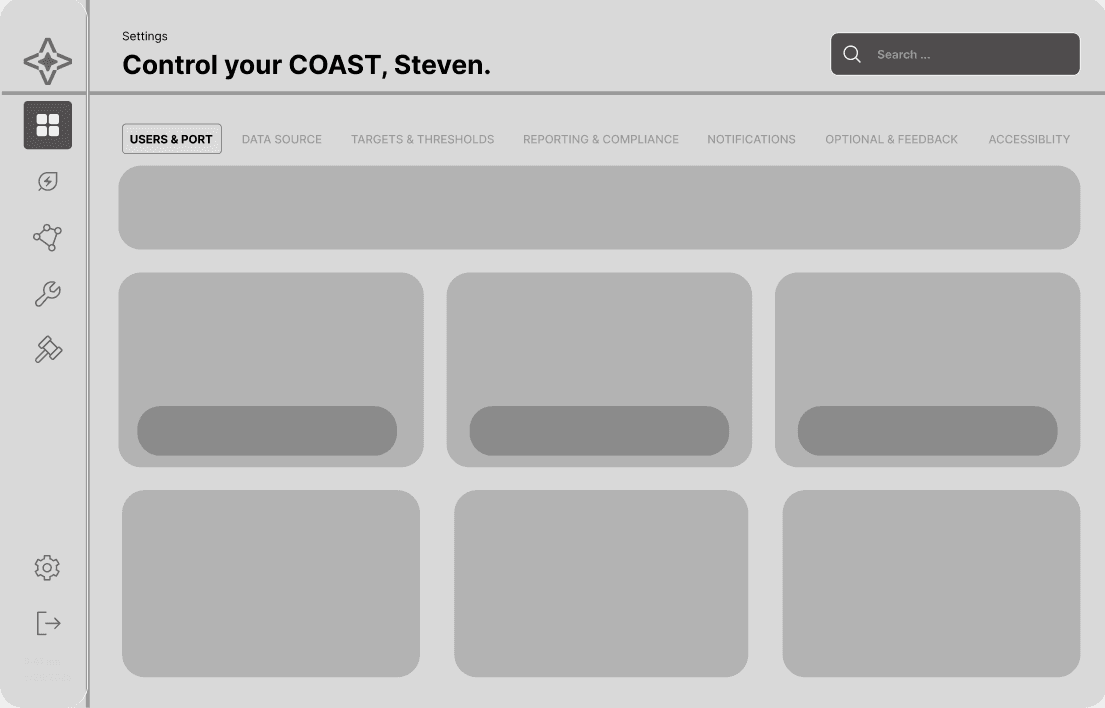
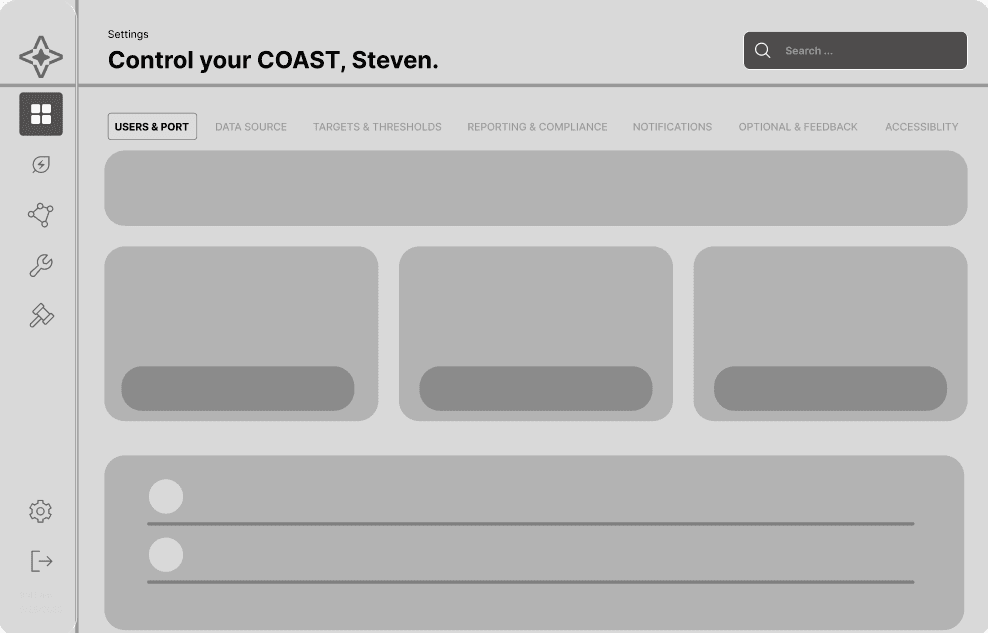
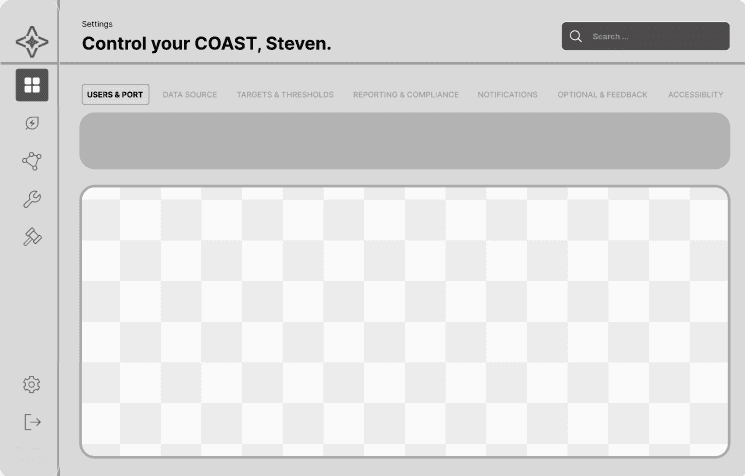
Mid-Fidelity Wireframes
We created mid-fidelity wireframes to visualize key interactions and support our workflow. These screens helped us refine layout, data clarity, and usability before moving into high-fidelity design.


Visual Identity
Primary Typography
Aa
Archivo
Medium, Semi-Bold, Bold
20pt
18pt
16pt
16pt
Archivo - Bold
Archivo - Semi-Bold
Archivo - Medium
Archivo - Bold
Heading 01
Heading 02
Body
Numbers
Brand Colors
#042222
#03624C
#2DC195
#01DF82
#F1F7F7
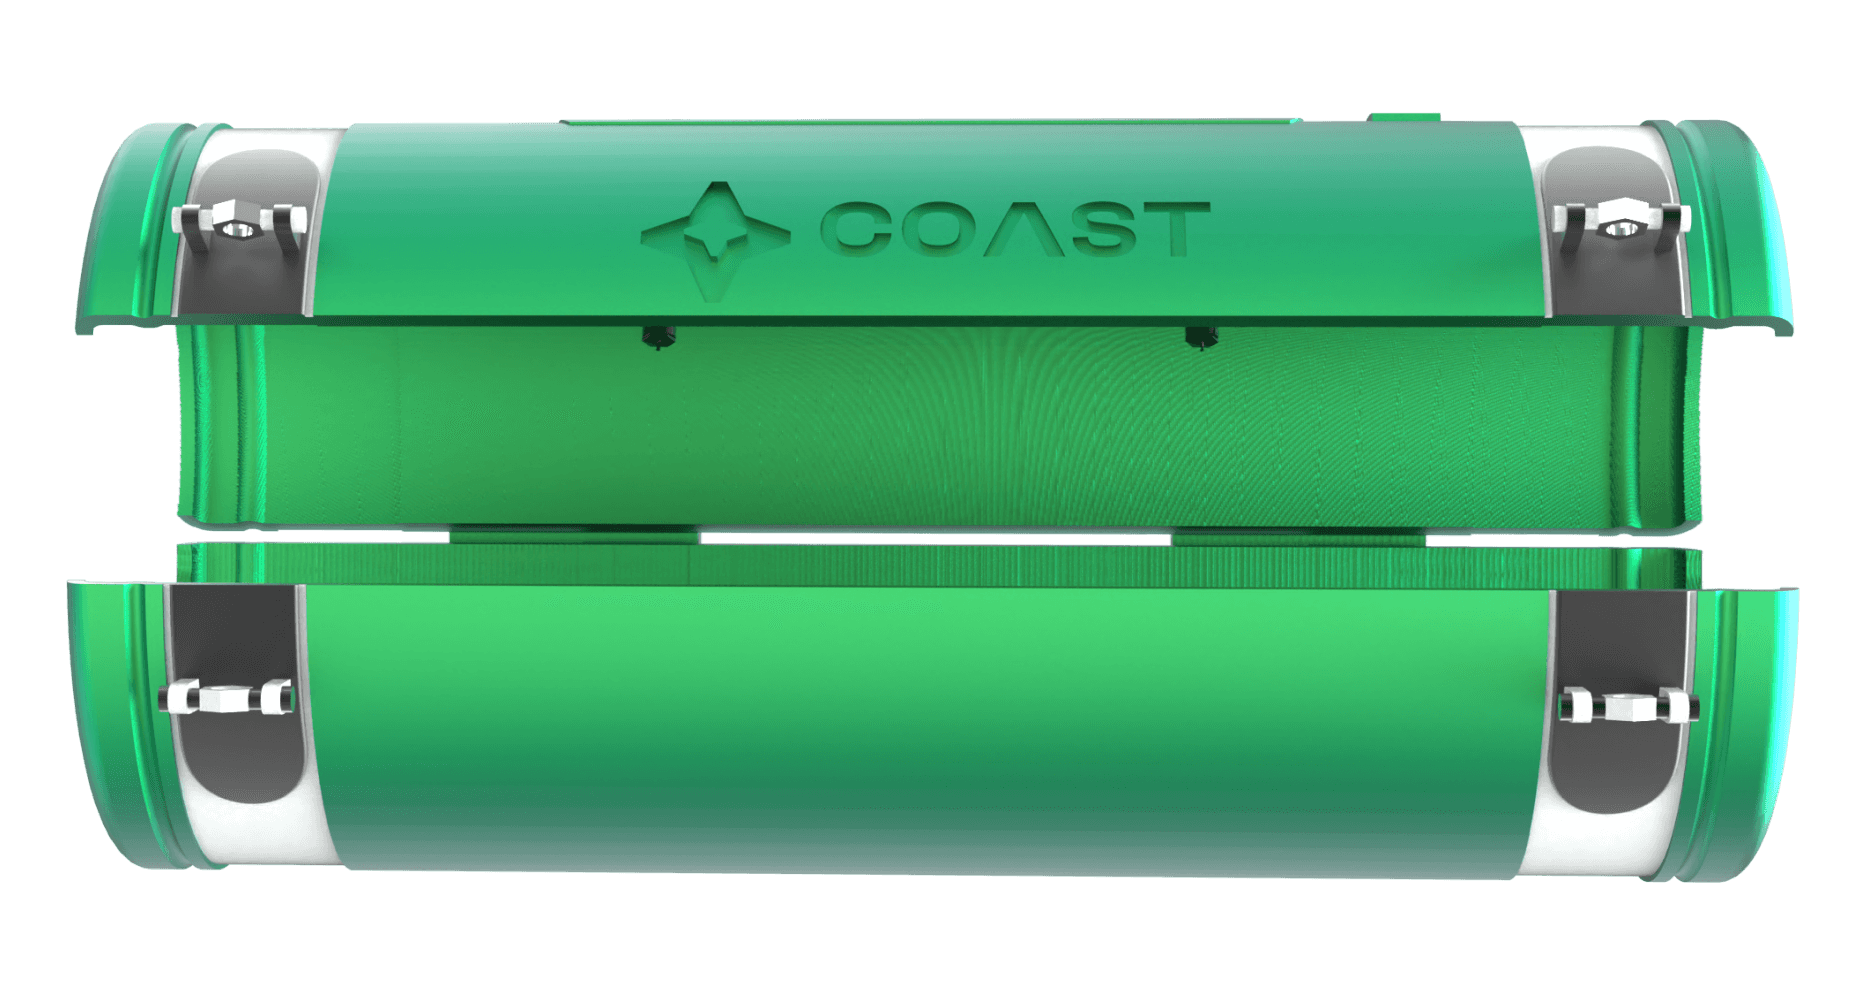
Physical Product
Simultaneously we dedicated time to developing and testing our physical product, focusing on refining its design, improving functionality, and ensuring it met both user needs and quality standards.
Learn how our physical product came to be!
view
Final Screens
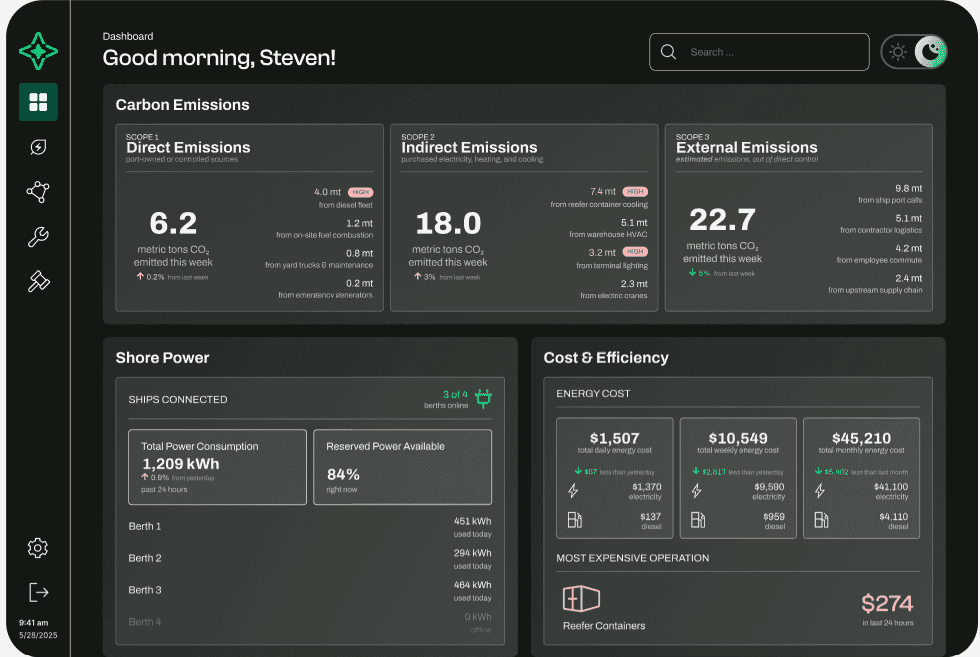
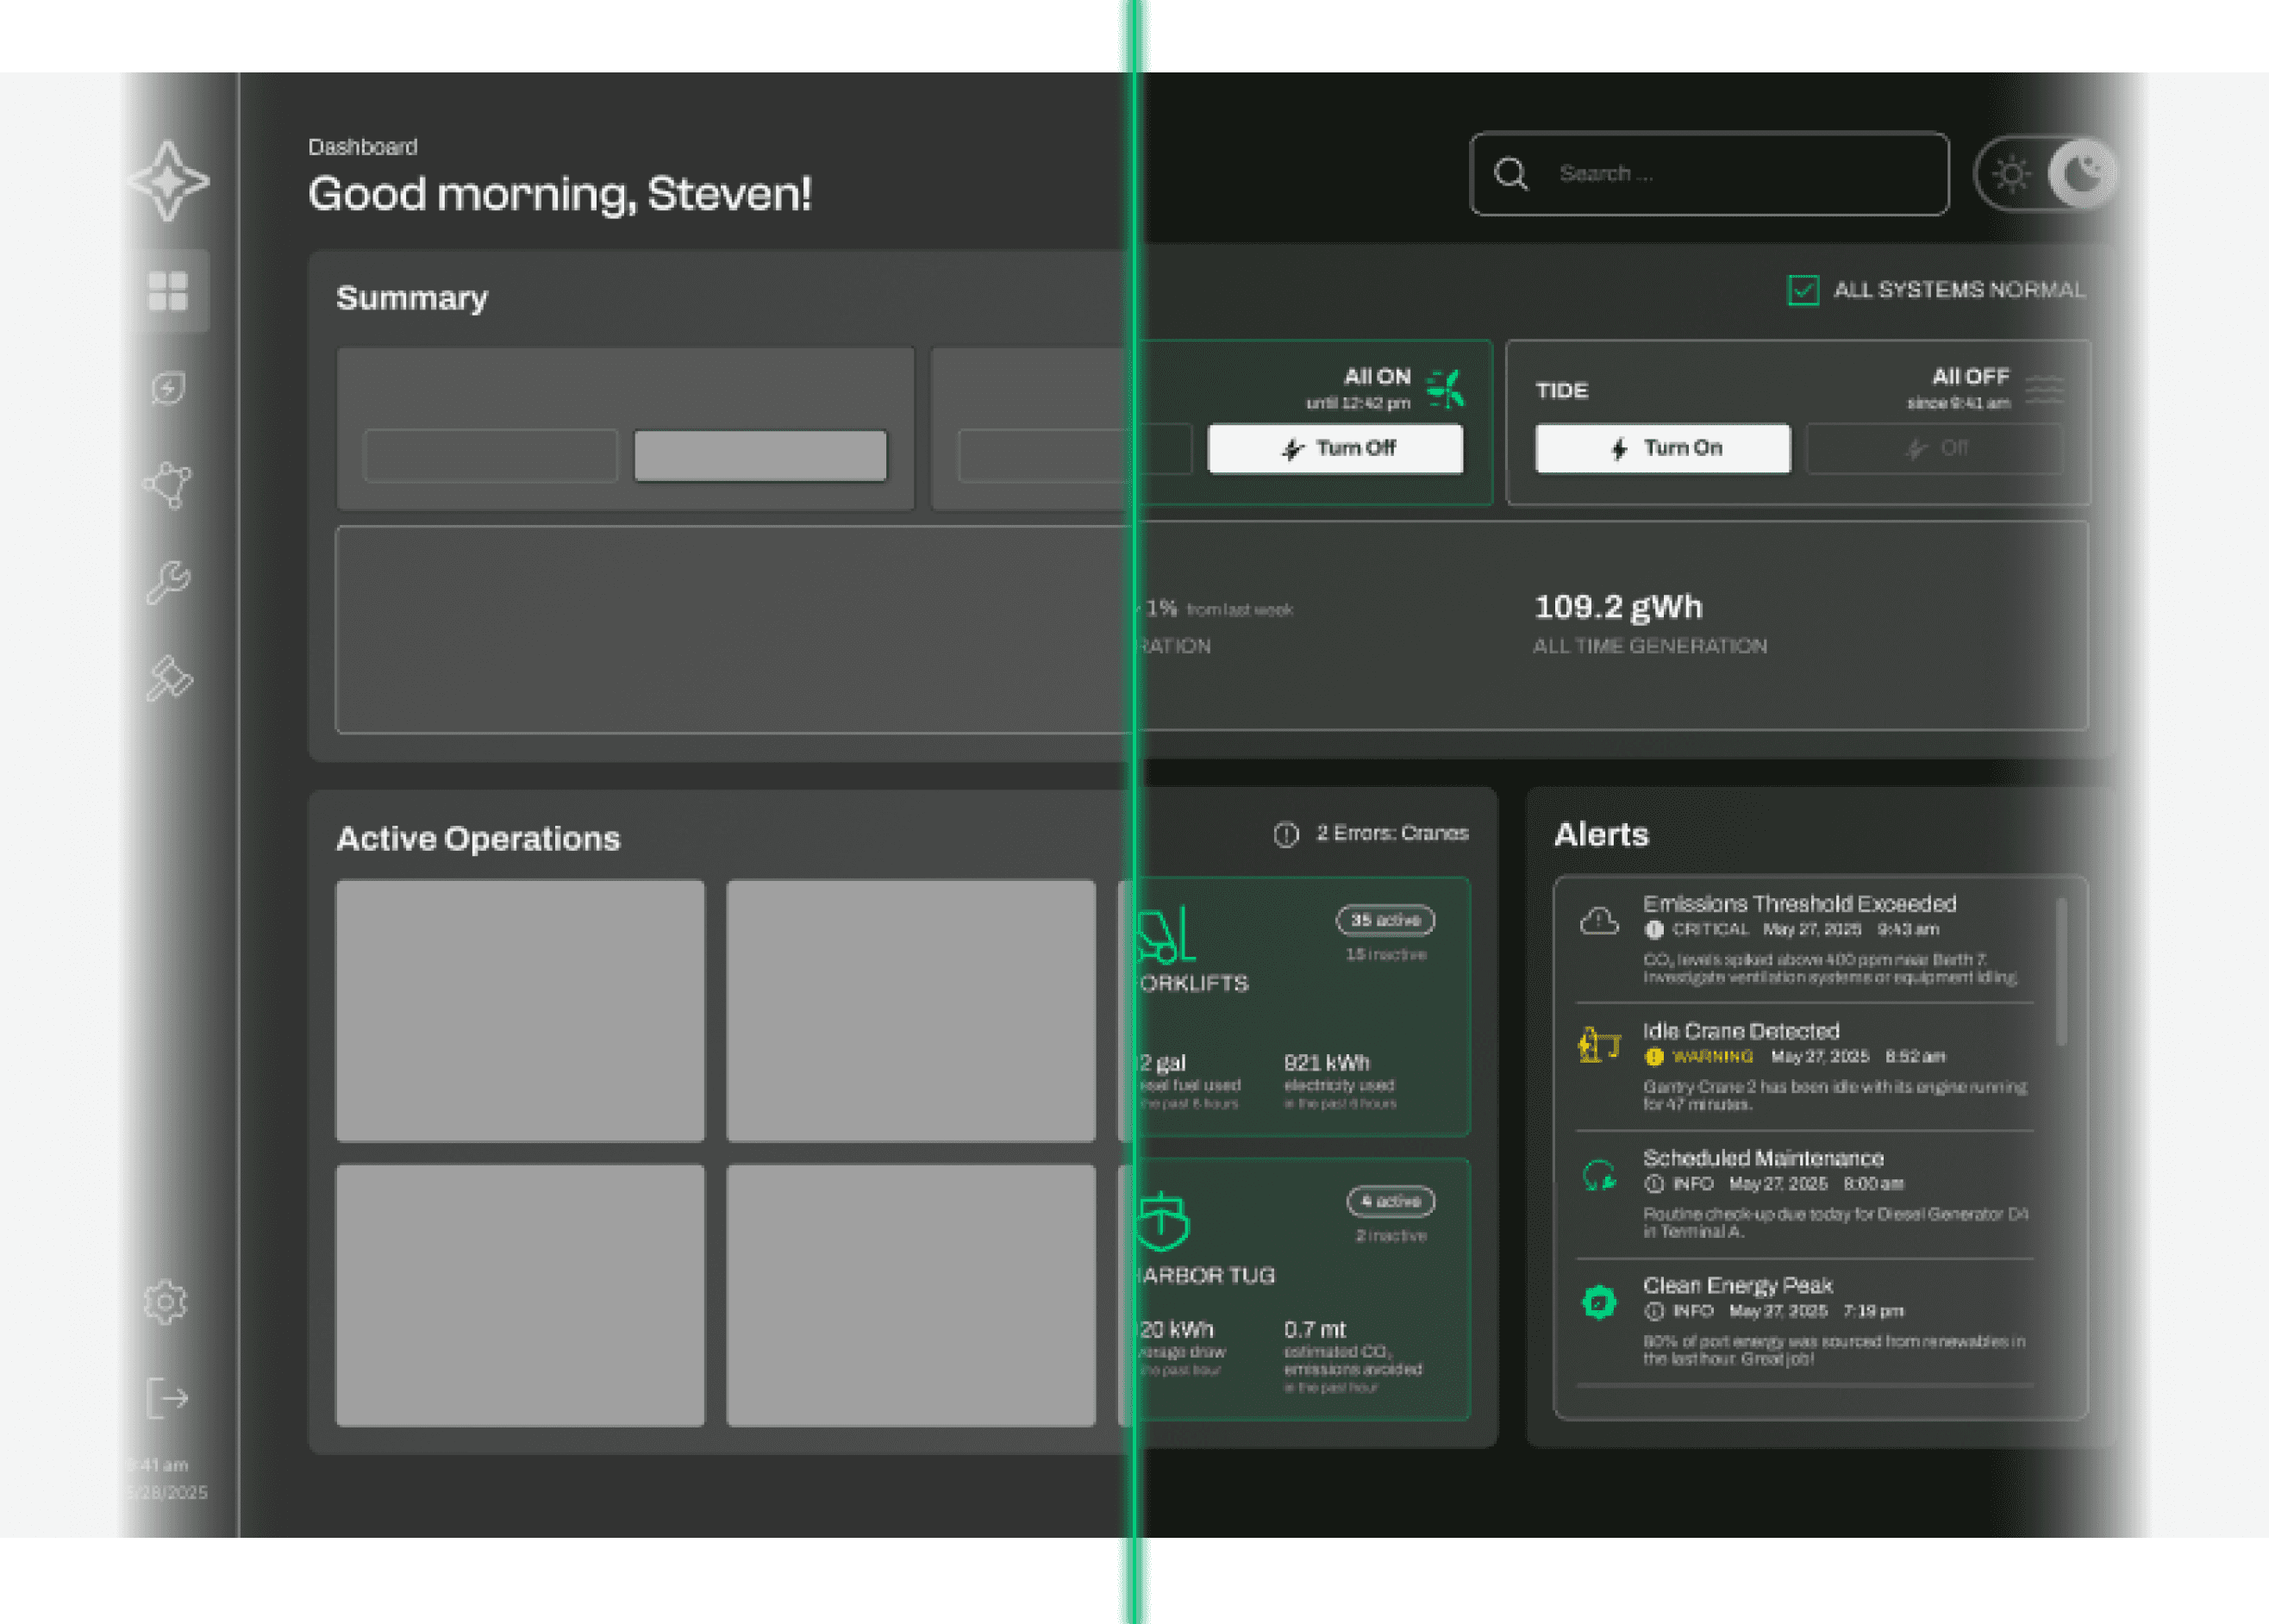
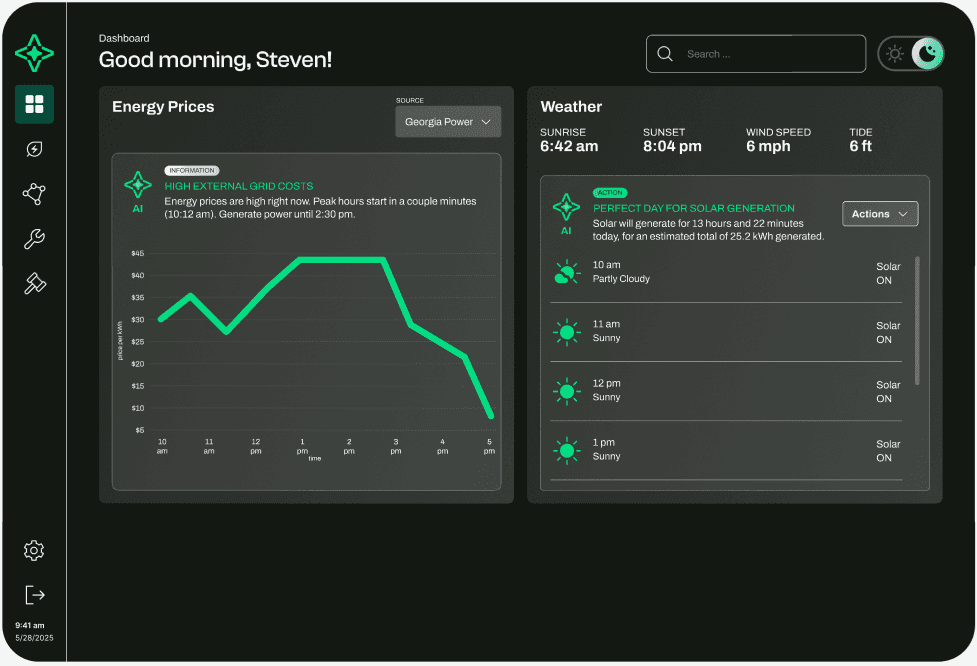
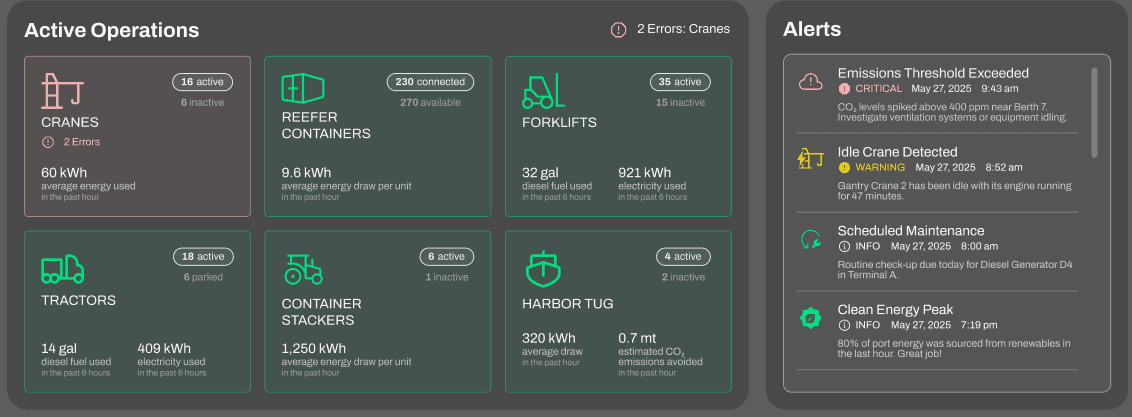
Dashboard
The Main Dashboard provides a comprehensive, real-time overview of sustainability metrics and performance across operations. It highlights key alerts, actionable insights, and personalized recommendations
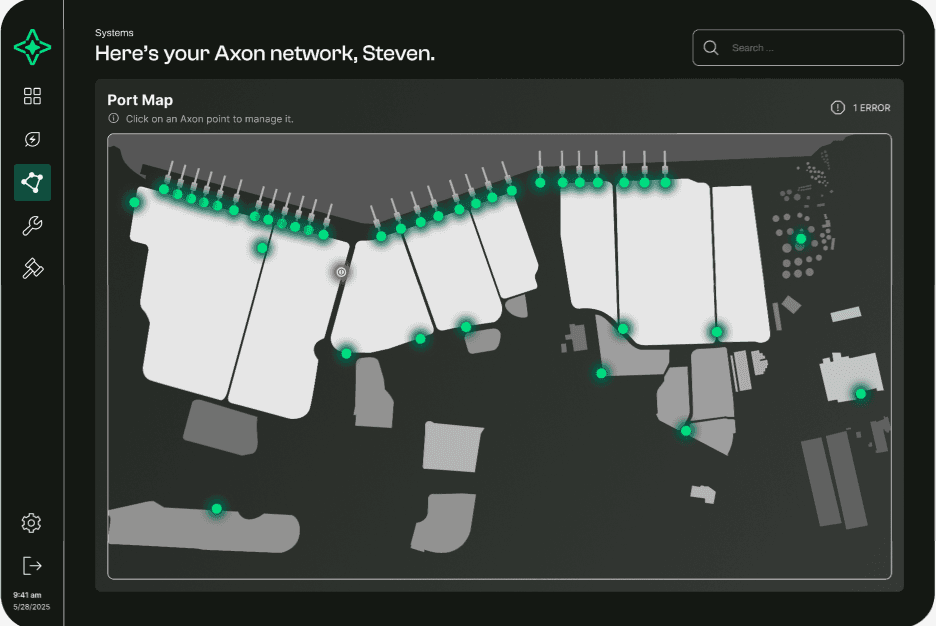
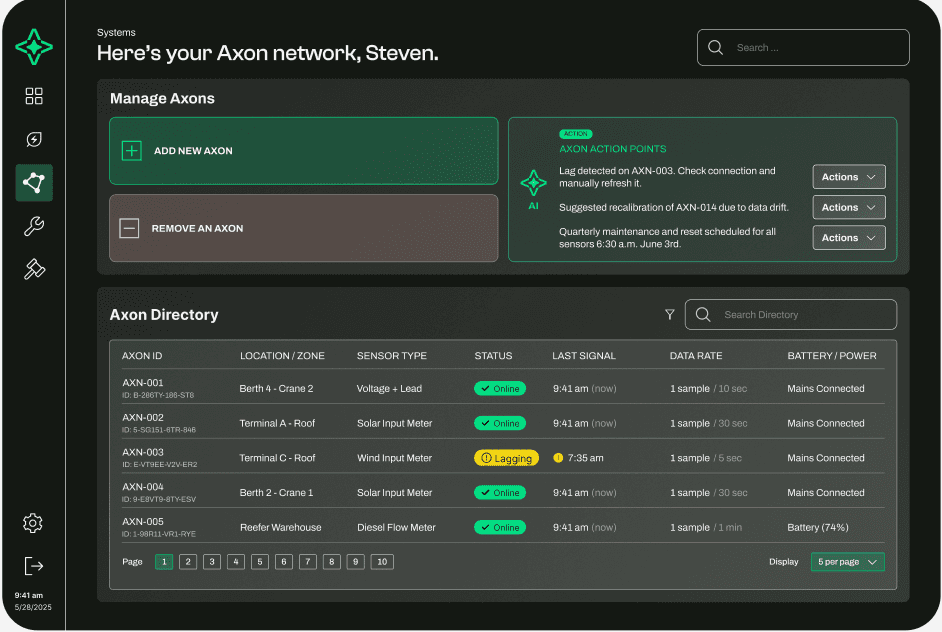
Systems
The Systems section offers detailed monitoring and management of all operational components related to sustainability. It provides real-time status updates, performance metrics, and alerts to help teams identify issues early and optimize system efficiency for better environmental impact and cost savings.
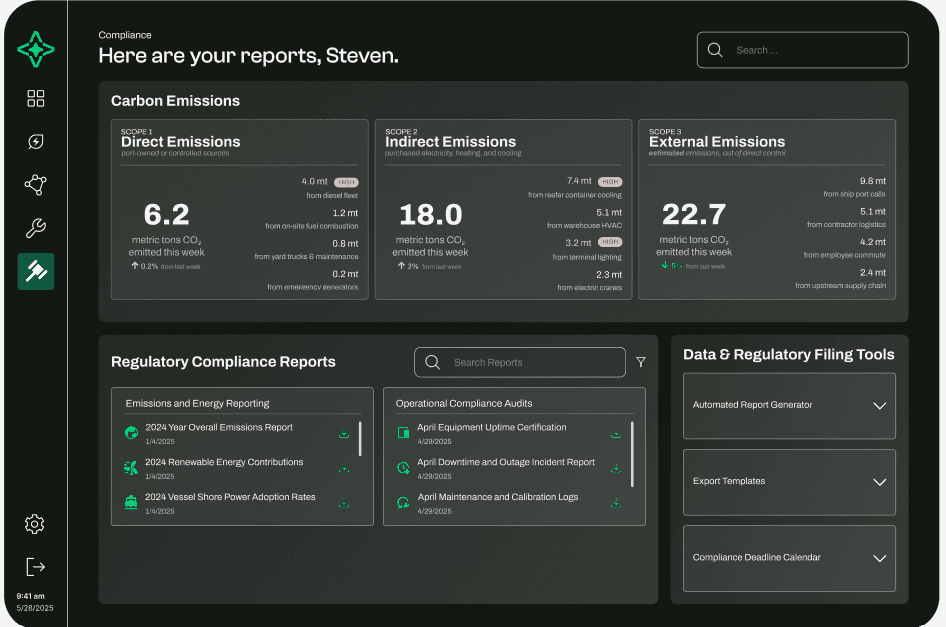
Compliance
The Compliance section tracks regulatory adherence and sustainability standards across operations. It delivers timely alerts and detailed reports to help teams stay aligned with environmental regulations, reduce risks, and ensure transparent reporting for all stakeholders.
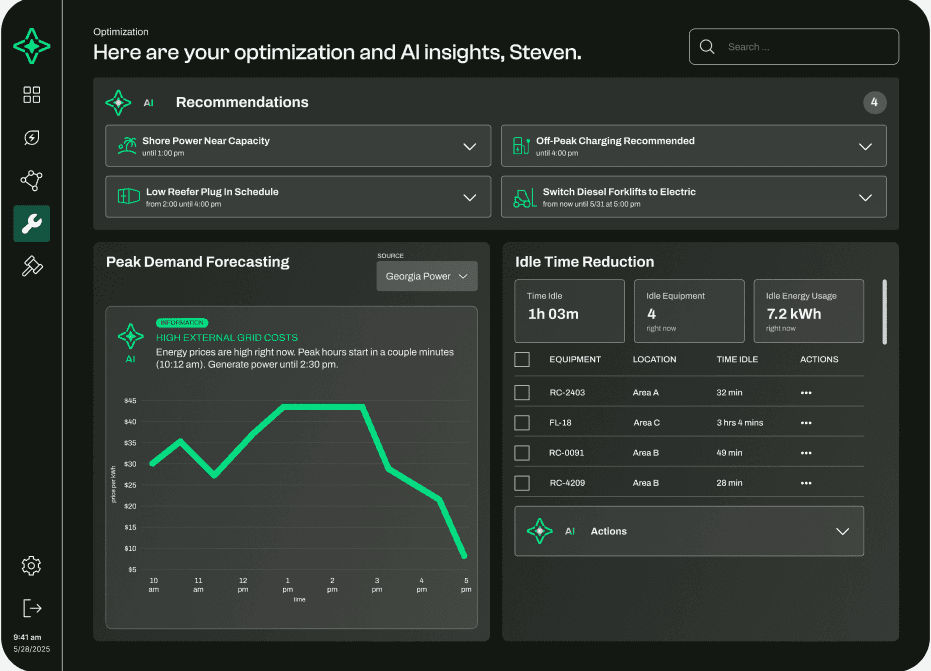
Optimization & AI
The Optimization & AI section leverages advanced algorithms to analyze operational data and recommend tailored strategies. It continuously identifies opportunities to improve energy efficiency, reduce waste, and maximize the impact of sustainability initiatives, driving smarter, data-backed decisions.
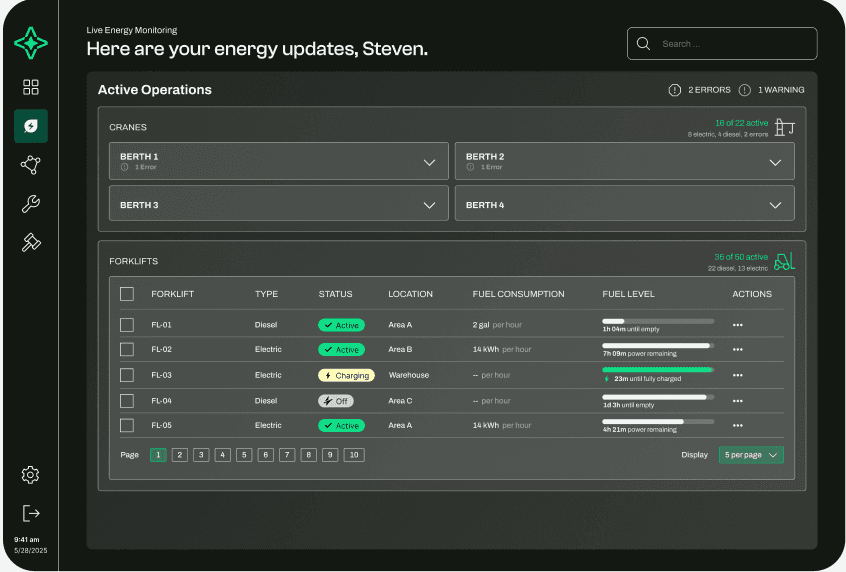
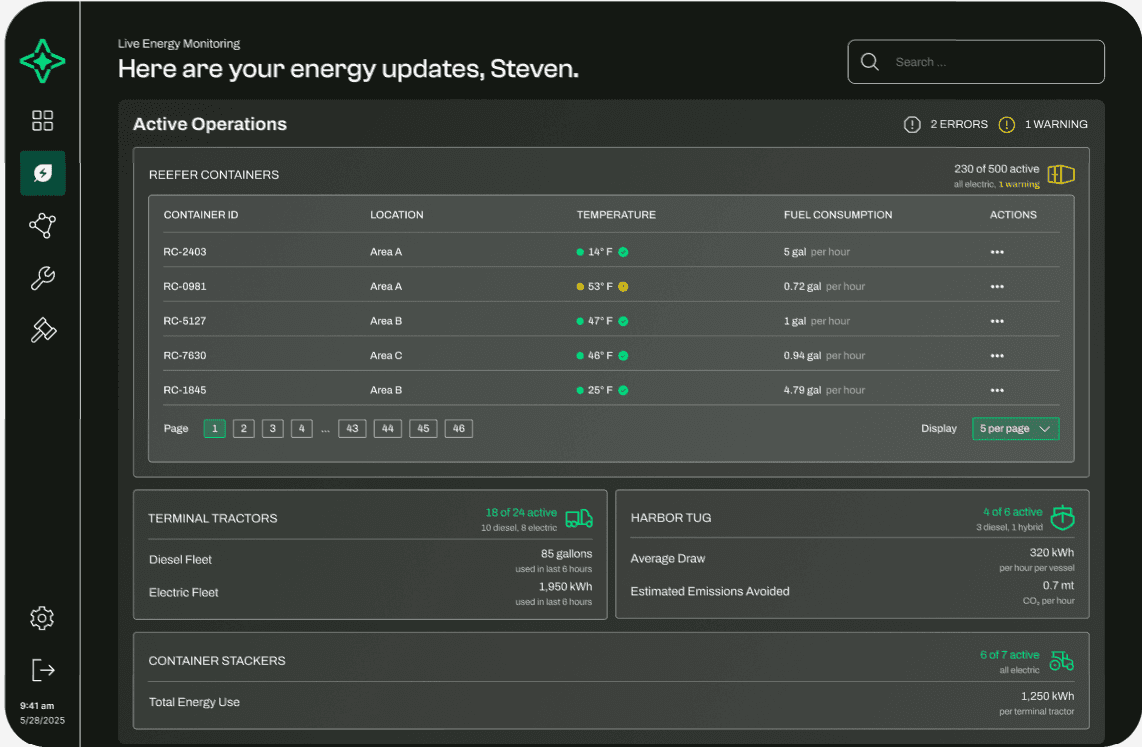
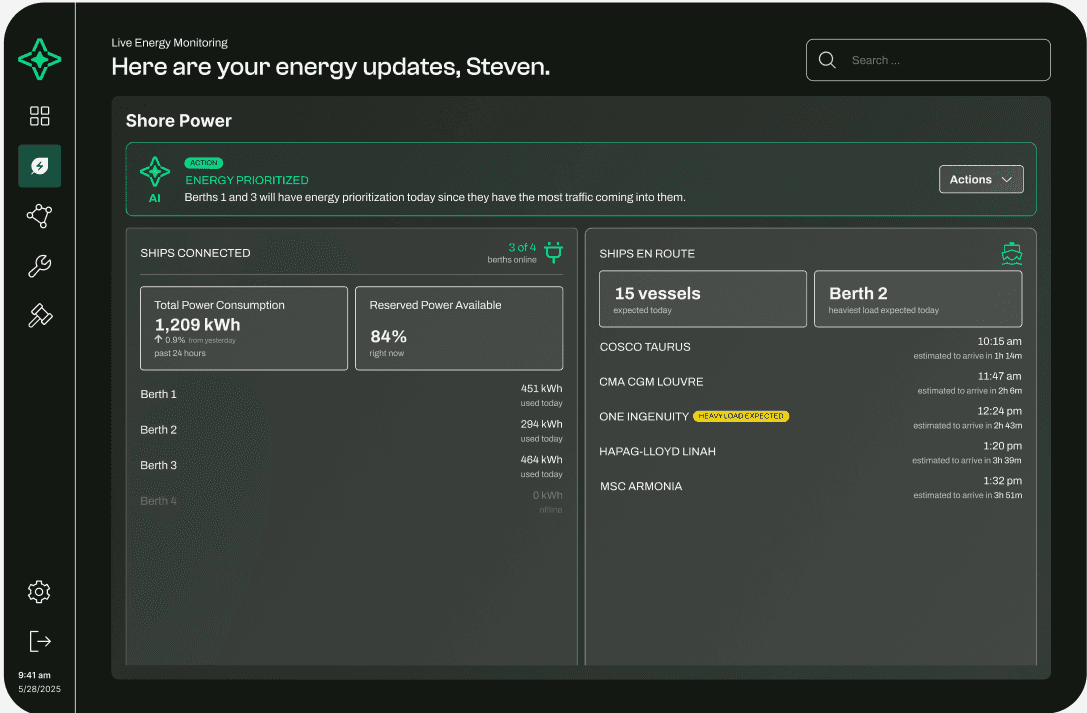
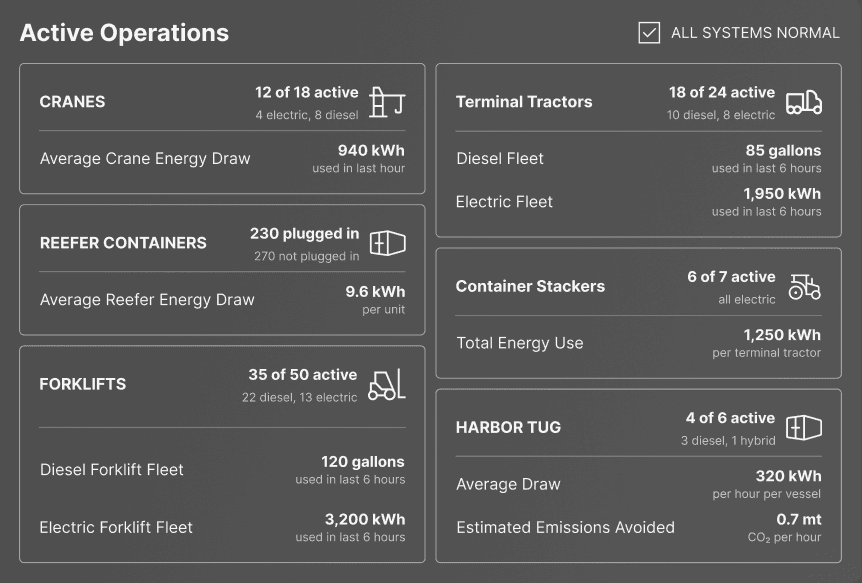
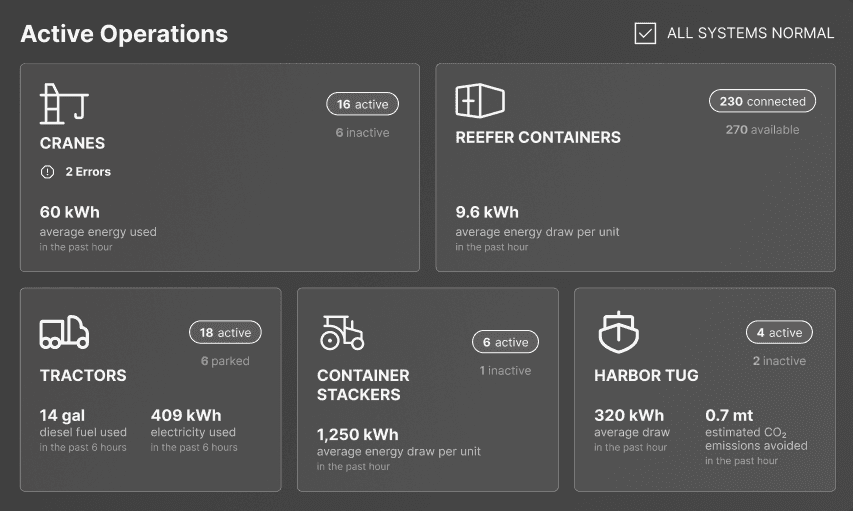
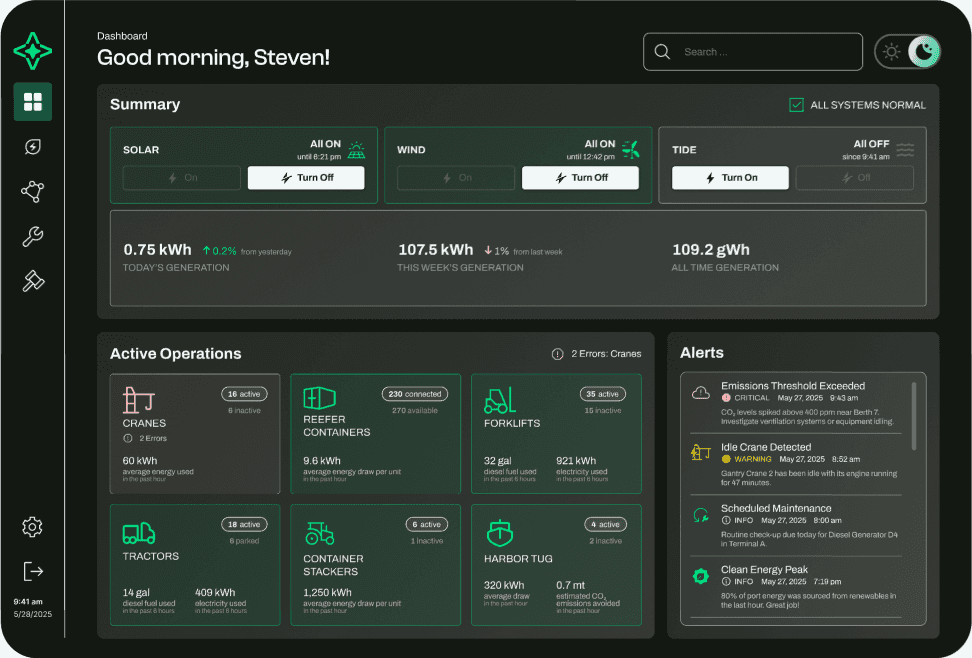
Live Energy Monitoring
The Live Energy Monitoring section provides real-time tracking of energy consumption across facilities and operations. It offers detailed visualizations and alerts to quickly identify inefficiencies, enabling teams to respond proactively and optimize energy use for greater sustainability.
Integrated Features
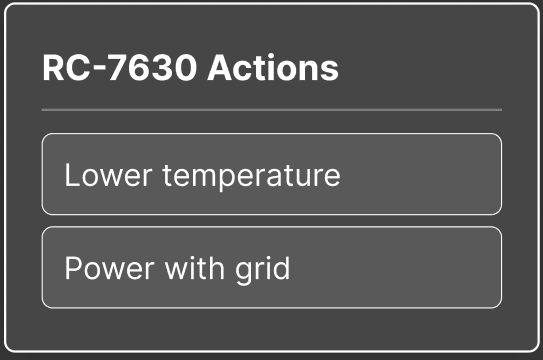
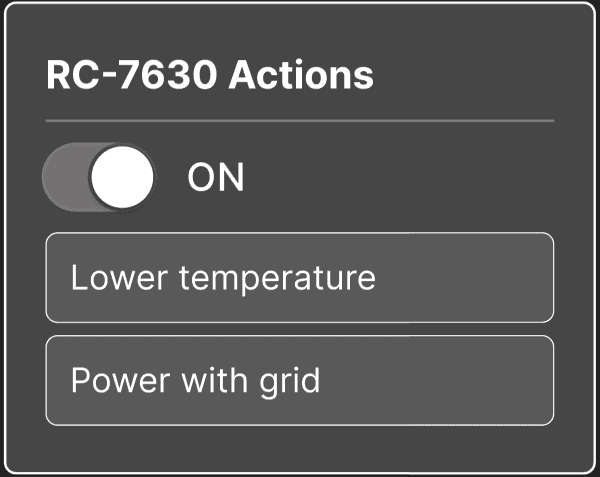
Quick Interactions
We designed simple, fast-touch tools so users can adjust settings or generate reports in seconds no digging or delays.
Data Privacy
We built in strong privacy settings and access controls, ensuring energy data stays secure and only visible to the right people.
TWO-FACTOR AUTHENTICATION
s*****@savport.com
primary method
***-***-5202
secondary method
Two-Factor Authentication
Secure your login with two-factor authentication (2FA).
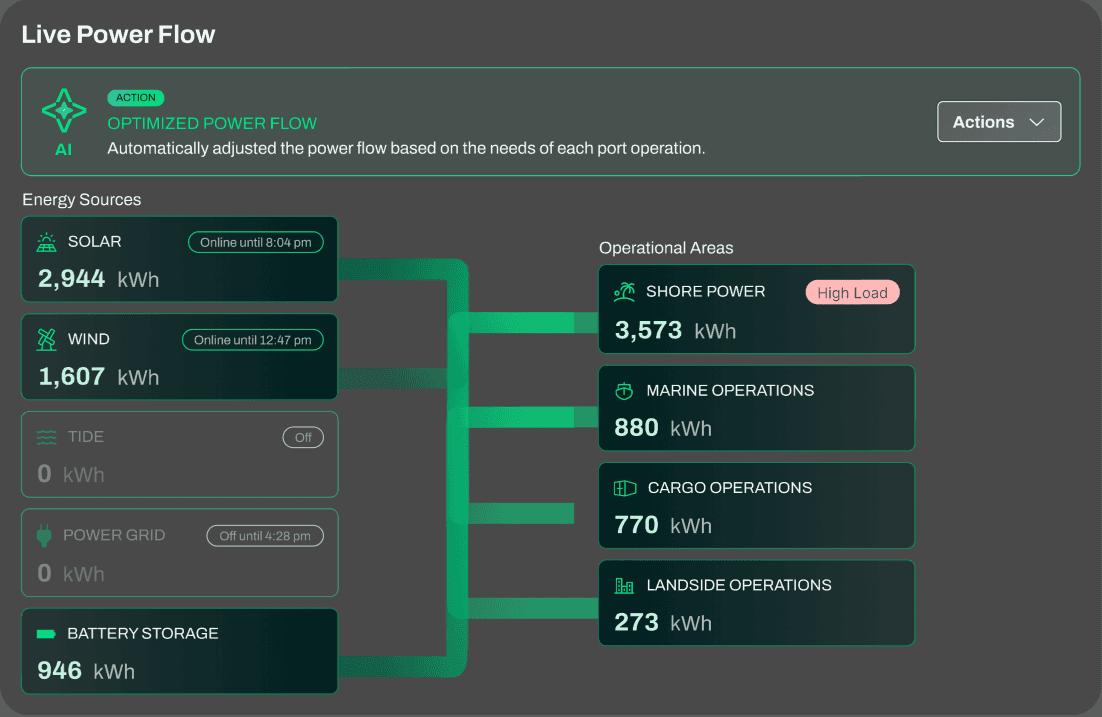
System Transparency
We created clear overviews of energy use and equipment status, giving users full visibility into every moving part.
Optimization Tools
We integrated AI suggestions that help reduce waste and improve performance giving users control to apply, delay, or dismiss as needed.
AI
Recommendations
2
Shore Power Near Capacity
until 1:00 pm
Berths 1 and 3 are at 88% draw. Stagger next two plug-ins by 15 min to avoid high grid charges.
Select the AI recommendations to activate:
RECOMMENDED
Redirect next plug in to Berth 2
RECOMMENDED
Inform Berth Operations of peak loads
Delay the next plug in at Berth 3 by 15 minutes
Discharge battery storage to temporarily supplement shore power at Berths 1 and 3
Berth Loads
updated just now
Berth 1
HIGH
88%
Berth 2
26%
Berth 3
HIGH
88%
Berth 4
offline
Accept recommendation
from now until 1:00 pm
Delay
Ignore
Low Reefer Plug In Schedule
from 2:00 until 4:00 pm
Only 62 reefer containers are scheduled to be plugged in from 2–4 p.m. It is recommend to concentrate crane use during this lull.
Select the AI recommendations to activate:
RECOMMENDED
Concentrate crane use
Reefer Container Capacity
20%
Reefer Capacity
Accept recommendation
starts at 2:00 pm until 4:00 pm
Delay
Ignore
Real-Time Insights
We surfaced live energy and fuel data in a clear, digestible format, helping users quickly understand what’s happening across systems. By highlighting trends, spikes, and usage patterns in real time, the interface supports fast, informed decisions whether it's identifying inefficiencies or optimizing operations on the fly.
Peak Demand Forecasting
SOURCE
Georgia Power
AI
INFORMATION
HIGH EXTERNAL GRID COSTS
Energy prices are high right now. Peak hours start in a couple minutes (10:12 am). Generate power until 2:30 pm.
price per kWh
$45
$40
$35
$30
$25
$20
$15
$10
$5
10
am
11
am
12
pm
1
pm
2
pm
3
pm
4
pm
5
pm
time
Idle Time Reduction
Time Idle
1h 03m
Idle Equipment
4
right now
Idle Energy Usage
7.2 kWh
right now
EQUIPMENT
LOCATION
TIME IDLE
ACTIONS
RC-2403
Area A
32 min
FL-18
Area C
3 hrs 4 mins
RC-0091
Area B
49 min
RC-4209
Area B
28 min
AI
Actions
Select the AI recommendations to activate:
Power down Crane 2 after 10-minute alert
Reassign Forklift FL-03 to maintenance zone
Power down Reefer RC-5127
Power down Terminal Tractor TT-14 after 10-minute alert
Flag repeat idle violations for review
Accept recommendations
Ignore
Compliance Tracking
We made it easy to monitor emissions and regulations, helping ports stay compliant without the paperwork overload.
Carbon Emissions
SCOPE 1
Direct Emissions
port-owned or controlled sources
6.2
metric tons CO₂ emitted this week
0.2%
from last week
4.0 mt
HIGH
from diesel fleet
1.2 mt
from on-site fuel combustion
0.8 mt
from yard trucks & maintenance
0.2 mt
from emergency generators
SCOPE 2
Indirect Emissions
purchased electricity, heating, and cooling
18.0
metric tons CO₂ emitted this week
3%
from last week
7.4 mt
HIGH
from reefer container cooling
5.1 mt
from warehouse HVAC
3.2 mt
HIGH
from terminal lighting
2.3 mt
from electric cranes
Human Centered Design
We crafted intuitive layouts and clear visuals to help users navigate complex systems without feeling overwhelmed.
Dashboard
Good morning, Steven!
Search ...

Lets Work Together
get in touch

Similar projects to this
Post Testing Iterations
Based on insights from Maze testing, we made several targeted refinements to our product. These included improving usability, adjusting design elements, and addressing user pain points to ensure a more seamless and intuitive experience.